Machine Translation Market by Application and Technology - Global Industry Analysis and Forecast to 2022
Published On : November 2017 Pages : 98 Category: Next Generation Technology Report Code : IC11344
Industry Outlook and Trend Analysis
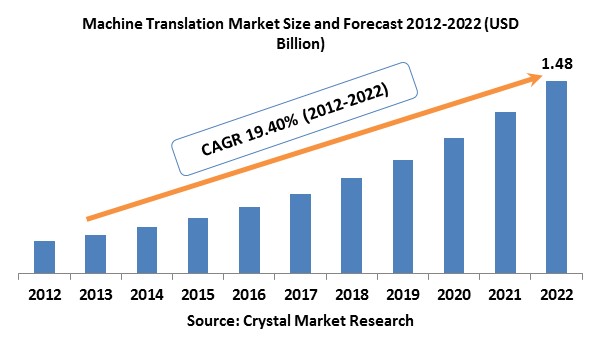
The global Machine Translation market was worth USD 0.25 billion in the year 2017 and is expected to reach approximately USD 1.48 billion by 2022, while registering itself at a compound annual growth rate (CAGR) of 19.40% during the forecast period. Expanding interest for cost productivity in translation, developing volume of site content, and the huge measure of dialect learning required surpasses the limit of human translation, which thusly is relied upon to fuel the machine translation market. Globalization eases the need to address the linguistic variety of local audiences and web content. The conception of content created on the internet, developing significance of businesses in developing markets, and the requirement for empowering worldwide coordinated effort among representatives is relied upon to drive machine translation market development over the gauge time frame. The costs of machine translation are relatively low in comparison to conventional human translation. It is additionally quicker than human translation and usually utilized for high-volume content that would alternatively take enormous assets for translation, which is foreseen to drive the machine translation market. Accessibility of translation engines that are free such as Google Translate and Microsoft Bing and absence of exactness of translation may inhibit market development. Significant difficulties for the machine translation market are an absence of quality, requirement for master aptitudes and post-altering, competition from translation service providers that are free, and trouble in quality estimation and measurement.
Application Outlook and Trend Analysis
Consumers in the electronics business require effective translation of reports keeping in mind the end goal to accelerate production procedures and time for marketing. An electronics organization needs distributing to be done in numerous languages to give commercial and marketing catalogs, web publishing, press releases for product launches, user manuals, commercial and marketing catalogs, and so on. Machine translation suppliers create modified engines for customers in the electronics sector that are well-informed with the business' technical descriptions and particular terminologies. The machine translation market discovers application in the healthcare industry to meet the correspondence requirements of doctors. Healthcare organizations depend on translation administrations of patient pamphlets, doctor manuals, leaflets, and instructions for use, sites and other critical correspondence materials.
Technology Outlook and Trend Analysis
RBMT is a system of machine translation in view of data about the target and source languages that is extracted from grammars and dictionaries which needs human contributions for development. The process of translation is determined by human specialists who build up an arrangement of guidelines overseeing the procedure. Statistical machine translation adopts a model to determine and produce text in the objective language, while translation that is rule-based makes use of linguistic guidelines over the source dialect to create message in the objective language.
The vast majority of the present RBMT systems are being supplanted by SMT, and the market has shifted towards more SMT as prime players, for example, Lionbridge, SDL, and other language specialist co-ops are putting forth unadulterated SMT.
Regional Outlook and Trend Analysis
Government activities and the existence of an expansive number of specialist organizations have helped support market development in the United States. Google and Microsoft, the biggest suppliers of technology situated in the United States, have made the technology of statistical machine translation well known with their free online engines. Globalization and requirement to address differing cultural gatherings have prompted the ubiquity of the technology of translation in Asia Pacific. The expansion of cell phones and expanding entrance of internet are foreseen to drive the growth of this market. Machine translation could provide a significant resolution in reducing language boundaries crosswise over various locales.
Competitive Insights
Most MT mediums are text-based and give quick translations between different languages in the form of text. Some others do offer the choice of language keyboards and audio input/output. Machine translation as a service (MTSaaS) utilizes SMT and is available by means of the web. This enables clients to alter their machine translation engine with their translation memories, otherwise called do-it-yourself machine translation. Building up an incorporated foundation is required to be a basic achievement factor for picking up share of the market. Subsequently, key joint endeavors, combined with acquisitions and mergers have been among the key procedures implemented. The major players in the market are Lionbridge, SYSTRAN and SDL plc.
The global Machine Translation market is segmented as follows-
By Application:
- Healthcare
- Automotive
- Electronics
- IT
- Military & Defense
- Others
By Technology:
- SMT
- RBMT
- Others
By Region
- North America
- U.S
- Canada
- Mexico
- Europe
- Germany
- France
- UK
- Italy
- Spain
- Rest of Europe
- Asia-Pacific
- Japan
- China
- Australia
- India
- South Korea
- Rest of Asia Pacific
- Rest of the World
- Brazil
- South Africa
- Saudi Arabia
- United Arab Emirates
- Others
Some of the key questions answered by the report are:
- What was the market size in 2017 and forecast from 2017 to 2022?
- What will be the industry market growth from 2017 to 2022?
- What are the major drivers, restraints, opportunities, challenges, and industry trends and their impact on the market forecast?
- What are the major segments leading the market growth and why?
- Which are the leading players in the market and what are the major strategies adopted by them to sustain the market competition?
Market Classification
- Machine Translation Market, By Application, Estimates and Forecast, 2012-2022 ($Million)
- Automotive
- Electronics
- Military & Defense
- Healthcare
- IT
- Other Applications
- Machine Translation Market, By Technology, Estimates and Forecast, 2012-2022 ($Million)
- SMT
- RBMT
- Other Technologies
- Machine Translation Market, By Region, Estimates and Forecast, 2012-2022 ($Million)
- North America
- North America Machine Translation Market, By Country
- North America Machine Translation Market, By Application
- North America Machine Translation Market, By Technology
- U.S. Machine Translation Market, By Application
- U.S. Machine Translation Market, By Technology
- Canada Machine Translation Market, By Application
- Canada Machine Translation Market, By Technology
- Mexico Machine Translation Market, By Application
- Mexico Machine Translation Market, By Technology
-
- Europe
- Europe Machine Translation Market, By Country
- Europe Machine Translation Market, By Application
- Europe Machine Translation Market, By Technology
- Germany Machine Translation Market, By Application
- Germany Machine Translation Market, By Technology
- France Machine Translation Market, By Application
- France Machine Translation Market, By Technology
- UK Machine Translation Market, By Application
- UK Machine Translation Market, By Technology
- Italy Machine Translation Market, By Application
- Italy Machine Translation Market, By Technology
- Spain Machine Translation Market, By Application
- Spain Machine Translation Market, By Technology
- Rest of Europe Machine Translation Market, By Application
- Rest of Europe Machine Translation Market, By Technology
-
- Asia-Pacific
- Asia-Pacific Machine Translation Market, By Country
- Asia-Pacific Machine Translation Market, By Application
- Asia-Pacific Machine Translation Market, By Technology
- Japan Machine Translation Market, By Application
- Japan Machine Translation Market, By Technology
- Australia Machine Translation Market, By Application
- Australia Machine Translation Market, By Technology
- India Machine Translation Market, By Application
- India Machine Translation Market, By Technology
- South Korea Machine Translation Market, By Application
- South Korea Machine Translation Market, By Technology
- Rest of Asia-Pacific Machine Translation Market, By Application
- Rest of Asia-Pacific Machine Translation Market, By Technology
- Asia-Pacific
-
- Rest of the World
- Rest of the World Machine Translation Market, By Country
- Rest of the World Machine Translation Market, By Application
- Rest of the World Machine Translation Market, By Technology
- Brazil Machine Translation Market, By Application
- Brazil Machine Translation Market, By Technology
- South Africa Machine Translation Market, By Application
- South Africa Machine Translation Market, By Technology
- Saudi Arabia Machine Translation Market, By Application
- Saudi Arabia Machine Translation Market, By Technology
- Turkey Machine Translation Market, By Application
- Turkey Machine Translation Market, By Technology
- United Arab Emirates Machine Translation Market, By Application
- United Arab Emirates Machine Translation Market, By Technology
- Others Machine Translation Market, By Application
- Others Machine Translation Market, By Technology
- Rest of the World
Table of Contents
1. Introduction
1.1. Report Description
1.2. Research Methodology
1.2.1. Secondary Research
1.2.2. Primary Research
2. Executive Summary
2.1. Key Highlights
3. Market Overview
3.1. Introduction
3.1.1. Market Definition
3.1.2. Market Segmentation
3.2. Market Dynamics
3.2.1. Drivers
3.2.1.1. Increasing demand for high speed translation and cost efficiency
3.2.1.2. Rising Need for Content Localization
3.2.2. Restraints
3.2.2.1. Lack of Accuracy and Quality
3.2.3. Opportunities
3.2.3.1. Emerging Markets to Offer Lucrative Growth Opportunities
4. Machine Translation Market, By Application
4.1. Introduction
4.2. Machine Translation Market Assessment and Forecast, By Application, 2012-2022
4.3. Automotive
4.3.1. Market Assessment and Forecast, By Region, 2012-2022 ($Million)
4.4. Electronics
4.4.1. Market Assessment and Forecast, By Region, 2012-2022 ($Million)
4.5. Military & Defense
4.5.1. Market Assessment and Forecast, By Region, 2012-2022 ($Million)
4.6. Healthcare
4.6.1. Market Assessment and Forecast, By Region, 2012-2022 ($Million)
4.7. IT
4.7.1. Market Assessment and Forecast, By Region, 2012-2022 ($Million)
4.8. Other Applications
4.8.1. Market Assessment and Forecast, By Region, 2012-2022 ($Million)
5. Machine Translation Market, By Technology
5.1. Introduction
5.2. The Machine Translation Market Assessment and Forecast, By Technology, 2012-2022
5.3. SMT
5.3.1.1. Market Assessment and Forecast, By Region, 2012-2022 ($Million)
5.4. RBMT
5.4.1.1. Market Assessment and Forecast, By Region, 2012-2022 ($Million)
5.5. Other Technologies
5.5.1.1. Market Assessment and Forecast, By Region, 2012-2022 ($Million)
6. Machine Translation Market, By Region
6.1. Introduction
6.2. Machine Translation Market Assessment and Forecast, By Region, 2012-2022 ($Million)
6.3. North America
6.3.1. Market Assessment and Forecast, By Country, 2012-2022 ($Million)
6.3.2. Market Assessment and Forecast, By Application, 2012-2022 ($Million)
6.3.3. Market Assessment and Forecast, By Technology, 2012-2022 ($Million)
6.3.4. U.S.
6.3.4.1. Market Assessment and Forecast, By Application, 2012-2022 ($Million)
6.3.4.2. Market Assessment and Forecast, By Technology, 2012-2022 ($Million)
6.3.5. Canada
6.3.5.1. Market Assessment and Forecast, By Application, 2012-2022 ($Million)
6.3.5.2. Market Assessment and Forecast, By Technology, 2012-2022 ($Million)
6.3.6. Mexico
6.3.6.1. Market Assessment and Forecast, By Application, 2012-2022 ($Million)
6.3.6.2. Market Assessment and Forecast, By Technology, 2012-2022 ($Million)
6.4. Europe
6.4.1. Market Assessment and Forecast, By Country, 2012-2022 ($Million)
6.4.2. Market Assessment and Forecast, By Application, 2012-2022 ($Million)
6.4.3. Market Assessment and Forecast, By Technology, 2012-2022 ($Million)
6.4.4. Germany
6.4.4.1. Market Assessment and Forecast, By Application, 2012-2022 ($Million)
6.4.4.2. Market Assessment and Forecast, By Technology, 2012-2022 ($Million)
6.4.5. France
6.4.5.1. Market Assessment and Forecast, By Application, 2012-2022 ($Million)
6.4.5.2. Market Assessment and Forecast, By Application, 2012-2022 ($Million)
6.4.6. UK
6.4.6.1. Market Assessment and Forecast, By Application, 2012-2022 ($Million)
6.4.6.2. Market Assessment and Forecast, By Technology, 2012-2022 ($Million)
6.4.7. Italy
6.4.7.1. Market Assessment and Forecast, By Application, 2012-2022 ($Million)
6.4.7.2. Market Assessment and Forecast, By Technology, 2012-2022 ($Million)
6.4.8. Spain
6.4.8.1. Market Assessment and Forecast, By Application, 2012-2022 ($Million)
6.4.8.2. Market Assessment and Forecast, By Technology, 2012-2022 ($Million)
6.4.9. Rest of Europe
6.4.9.1. Market Assessment and Forecast, By Application, 2012-2022 ($Million)
6.4.9.2. Market Assessment and Forecast, By Technology, 2012-2022 ($Million)
6.5. Asia-Pacific
6.5.1. Market Assessment and Forecast, By Country, 2012-2022 ($Million)
6.5.2. Market Assessment and Forecast, By Application, 2012-2022 ($Million)
6.5.3. Market Assessment and Forecast, By Technology, 2012-2022 ($Million)
6.5.4. Japan
6.5.4.1. Market Assessment and Forecast, By Application, 2012-2022 ($Million)
6.5.4.2. Market Assessment and Forecast, By Technology, 2012-2022 ($Million)
6.5.5. China
6.5.5.1. Market Assessment and Forecast, By Application, 2012-2022 ($Million)
6.5.5.2. Market Assessment and Forecast, By Technology, 2012-2022 ($Million)
6.5.6. Australia
6.5.6.1. Market Assessment and Forecast, By Application, 2012-2022 ($Million)
6.5.6.2. Market Assessment and Forecast, By Technology, 2012-2022 ($Million)
6.5.7. India
6.5.7.1. Market Assessment and Forecast, By Application, 2012-2022 ($Million)
6.5.7.2. Market Assessment and Forecast, By Technology, 2012-2022 ($Million)
6.5.8. South Korea
6.5.8.1. Market Assessment and Forecast, By Application, 2012-2022 ($Million)
6.5.8.2. Market Assessment and Forecast, By Technology, 2012-2022 ($Million)
6.5.9. Rest of Asia-Pacific
6.5.9.1. Market Assessment and Forecast, By Application, 2012-2022 ($Million)
6.5.9.2. Market Assessment and Forecast, By Technology, 2012-2022 ($Million)
6.6. Rest of the World
6.6.1. Market Assessment and Forecast, By Country, 2012-2022 ($Million)
6.6.2. Market Assessment and Forecast, By Application, 2012-2022 ($Million)
6.6.3. Market Assessment and Forecast, By Technology, 2012-2022 ($Million)
6.6.4. Brazil
6.6.4.1. Market Assessment and Forecast, By Application, 2012-2022 ($Million)
6.6.4.2. Market Assessment and Forecast, By Technology, 2012-2022 ($Million)
6.6.5. Turkey
6.6.5.1. Market Assessment and Forecast, By Application, 2012-2022 ($Million)
6.6.5.2. Market Assessment and Forecast, By Technology, 2012-2022 ($Million)
6.6.6. Saudi Arabia
6.6.6.1. Market Assessment and Forecast, By Application, 2012-2022 ($Million)
6.6.6.2. Market Assessment and Forecast, By Technology, 2012-2022 ($Million)
6.6.7. South Africa
6.6.7.1. Market Assessment and Forecast, By Application, 2012-2022 ($Million)
6.6.7.2. Market Assessment and Forecast, By Technology, 2012-2022 ($Million)
6.6.8. United Arab Emirates
6.6.8.1. Market Assessment and Forecast, By Application, 2012-2022 ($Million)
6.6.8.2. Market Assessment and Forecast, By Technology, 2012-2022 ($Million)
6.6.9. Others
6.6.9.1. Market Assessment and Forecast, By Application, 2012-2022 ($Million)
6.6.9.2. Market Assessment and Forecast, By Technology, 2012-2022 ($Million)
7. Company Profiles
7.1. AppTek LLC
7.1.1. Business Overview
7.1.2. Product Portfolio
7.1.3. Key Financials
7.1.4. Strategic Developments
7.2. Google Inc.
7.2.1. Business Overview
7.2.2. Product Portfolio
7.2.3. Key Financials
7.2.4. Strategic Developments
7.3. Cloudwords, Inc.
7.3.1. Business Overview
7.3.2. Product Portfolio
7.3.3. Strategic Developments
7.4. IBM Corporation
7.4.1. Business Overview
7.4.2. Product Portfolio
7.4.3. Key Financials
7.4.4. Strategic Developments
7.5. Lingo24 Limited
7.5.1. Business Overview
7.5.2. Product Portfolio
7.5.3. Key Financials
7.5.4. Strategic Developments
7.6. Lighthouse IP Group
7.6.1. Business Overview
7.6.2. Product Portfolio
7.6.3. Key Financials
7.6.4. Strategic Developments
7.7. Lingotek, Inc.
7.7.1. Business Overview
7.7.2. Product Portfolio
7.7.3. Key Financials
7.7.4. Strategic Developments
7.8. Microsoft Corporation
7.8.1. Business Overview
7.8.2. Product Portfolio
7.8.3. Key Financials
7.8.4. Strategic Developments
7.9. Lionbridge Technologies, Inc.
7.9.1. Business Overview
7.9.2. Product Portfolio
7.9.3. Key Financials
7.9.4. Strategic Developments
7.10. Moravia IT
7.10.1. Business Overview
7.10.2. Product Portfolio
7.10.3. Key Financials
7.10.4. Strategic Developments
7.11. Lucy Software and Services GmbH
7.11.1. Business Overview
7.11.2. Product Portfolio
7.11.3. Key Financials
7.11.4. Strategic Developments
7.12. Omniscien Technologies
7.12.1. Business Overview
7.12.2. Product Portfolio
7.12.3. Key Financials
7.12.4. Strategic Developments
7.13. PROMT Ltd.
7.13.1. Business Overview
7.13.2. Product Portfolio
7.13.3. Key Financials
7.13.4. Strategic Developments
7.14. PangeanicMT
7.14.1. Business Overview
7.14.2. Product Portfolio
7.14.3. Key Financials
7.14.4. Strategic Developments
List of Tables
List of Tables
Table 1.Global Machine Translation Market, By Application ($Million), 2012-2022
Table 2.Automotive Market, By Region ($Million), 2012-2022
Table 3.Electronics Market, By Region ($Million), 2012-2022
Table 4.Military & Defense Market, By Region ($Million), 2012-2022
Table 5.Healthcare Market, By Region ($Million), 2012-2022
Table 6.IT Market, By Region ($Million), 2012-2022
Table 7.Other Applications Market, By Region ($Million), 2012-2022
Table 8.Machine Translation Market, By Technology ($Million), 2012-2022
Table 9.SMT Market, By Region ($Million), 2012-2022
Table 10.RBMT Market, By Region ($Million), 2012-2022
Table 11.Other Technologies Market, By Region ($Million), 2012-2022
Table 12.Machine Translation Market, By Region ($Million), 2012-2022
Table 13.North America Machine Translation Market, By Country, 2012-2022 ($Million)
Table 14.North America Machine Translation Market, By Application, 2012-2022 ($Million)
Table 15.North America Machine Translation Market, By Technology, 2012-2022 ($Million)
Table 16.U.S. Machine Translation Market, by Application, 2012-2022 ($Million)
Table 17.U.S. Machine Translation Market, by Technology, 2012-2022 ($Million)
Table 16.Canada Machine Translation Market, By Application, 2012-2022 ($Million)
Table 17.Canada Machine Translation Market, By Technology, 2012-2022 ($Million)
Table 18.Mexico Machine Translation Market, By Application, 2012-2022 ($Million)
Table 19.Mexico Machine Translation Market, By Technology, 2012-2022 ($Million)
Table 20.Europe Machine Translation Market, By Country, 2012-2022 ($Million)
Table 21.Europe Machine Translation Market, By Application, 2012-2022 ($Million)
Table 23.Europe Machine Translation Market, By Technology, 2012-2022 ($Million)
Table 24.Germany Machine Translation Market, By Application, 2012-2022 ($Million)
Table 25.Germany Machine Translation Market, By Technology, 2012-2022 ($Million)
Table 26.France Machine Translation Market, By Application, 2012-2022 ($Million)
Table 27.France Machine Translation Market, By Technology, 2012-2022 ($Million)
Table 28.UK Machine Translation Market, By Application, 2012-2022 ($Million)
Table 29.UK Machine Translation Market, By Technology, 2012-2022 ($Million)
Table 30.Italy Machine Translation Market, By Application, 2012-2022 ($Million)
Table 31.Italy Machine Translation Market, By Technology, 2012-2022 ($Million)
Table 32.Spain Machine Translation Market, By Application, 2012-2022 ($Million)
Table 33.Spain Machine Translation Market, By Technology, 2012-2022 ($Million)
Table 36.Rest of Europe Machine Translation Market, By Application, 2012-2022 ($Million)
Table 37.Rest of Europe Machine Translation Market, By Technology, 2012-2022 ($Million)
Table 38.Asia-Pacific Machine Translation Market, By Country, 2012-2022 ($Million)
Table 39.Asia-Pacific Machine Translation Market, By Application, 2012-2022 ($Million)
Table 40.Asia-Pacific Machine Translation Market, By Technology, 2012-2022 ($Million)
Table 41.Japan Machine Translation Market, By Application, 2012-2022 ($Million)
Table 42.Japan Machine Translation Market, By Technology, 2012-2022 ($Million)
Table 43.China Machine Translation Market, By Application, 2012-2022 ($Million)
Table 44.China Machine Translation Market, By Technology, 2012-2022 ($Million)
Table 45.Australia Machine Translation Market, By Application, 2012-2022 ($Million)
Table 46.Australia Machine Translation Market, By Technology, 2012-2022 ($Million)
Table 47.India Machine Translation Market, By Application, 2012-2022 ($Million)
Table 48.India Machine Translation Market, By Technology, 2012-2022 ($Million)
Table 49.South Korea Machine Translation Market, By Application, 2012-2022 ($Million)
Table 50.South Korea Machine Translation Market, By Technology, 2012-2022 ($Million)
Table 53.Rest of Asia-Pacific Machine Translation Market, By Application, 2012-2022 ($Million)
Table 54.Rest of Asia-Pacific Machine Translation Market, By Technology, 2012-2022 ($Million)
Table 55.Rest of the World Machine Translation Market, By Country, 2012-2022 ($Million)
Table 56.Rest of the World Machine Translation Market, By Application, 2012-2022 ($Million)
Table 57.Rest of the World Machine Translation Market, By Technology, 2012-2022 ($Million)
Table 58.Brazil Machine Translation Market, By Application, 2012-2022 ($Million)
Table 59.Brazil Machine Translation Market, By Technology, 2012-2022 ($Million)
Table 60.Turkey Machine Translation Market, By Application, 2012-2022 ($Million)
Table 61.Turkey Machine Translation Market, By Technology, 2012-2022 ($Million)
Table 62.Saudi Arabia Machine Translation Market, By Application, 2012-2022 ($Million)
Table 63.Saudi Arabia Machine Translation Market, By Technology, 2012-2022 ($Million)
Table 64.South Africa Machine Translation Market, By Application, 2012-2022 ($Million)
Table 65.South Africa Machine Translation Market, By Technology, 2012-2022 ($Million)
Table 66.United Arab Emirates Machine Translation Market, By Application, 2012-2022 ($Million)
Table 67.United Arab Emirates Machine Translation Market, By Technology, 2012-2022 ($Million)
Table 68.Others Machine Translation Market, By Application, 2012-2022 ($Million)
Table 69.Others Machine Translation Market, By Technology, 2012-2022 ($Million)
Table 70.AppTek LLC: Key Strategic Developments, 2017-2017
Table 71.Google Inc.: Key Strategic Developments, 2017-2017
Table 72.Cloudwords, Inc.: Key Strategic Developments, 2017-2017
Table 73.IBM Corporation: Key Strategic Developments, 2017-2017
Table 74.Lingo24 Limited: Key Strategic Developments, 2017-2017
Table 75.Lighthouse IP Group: Key Strategic Developments, 2017-2017
Table 76.Lingotek, Inc.: Key Strategic Developments, 2017-2017
Table 77.Microsoft Corporation: Key Strategic Developments, 2017-2017
Table 78.Lionbridge Technologies, Inc.: Key Strategic Developments, 2017-2017
Table 79.Moravia IT: Key Strategic Developments, 2017-2017
Table 80.Lucy Software and Services GmbH: Key Strategic Developments, 2017-2017
Table 81.Omniscien Technologies: Key Strategic Developments, 2017-2017
Table 82.PROMT Ltd.: Key Strategic Developments, 2017-2017
Table 83.PangeanicMT: Key Strategic Developments, 2017-2017
List of Figures
List of Figures
Figure 1.Global Machine Translation Market Share, By Application, 2012 & 2022
Figure 2.Machine Translation Market, By Technology, 2012 & 2022, ($Million)
Figure 3.Machine Translation Market, By Region, 2012 & 2022, ($Million)
Figure 4.AppTek LLC: Net Revenues, 2017-2017 ($Million)
Figure 5.AppTek LLC: Net Revenue Share, By Segment, 2017
Figure 6.AppTek LLC: Net Revenue Share, By Geography, 2017
Figure 7.Google Inc.: Net Revenues, 2017-2017 ($Million)
Figure 8.Google Inc.: Net Revenue Share, By Segment, 2017
Figure 9.Google Inc.: Net Revenue Share, By Geography, 2017
Figure 10.Cloudwords, Inc.: Net Revenues, 2017-2017 ($Million)
Figure 11.Cloudwords, Inc.: Net Revenue Share, By Segment, 2017
Figure 12.Cloudwords, Inc.: Net Revenue Share, By Geography, 2017
Figure 13.IBM Corporation: Net Revenues, 2017-2017 ($Million)
Figure 14.IBM Corporation: Net Revenue Share, By Segment, 2017
Figure 15.IBM Corporation: Net Revenue Share, By Geography, 2017
Figure 16.Lingo24 Limited: Net Revenues, 2017-2017 ($Million)
Figure 17.Lingo24 Limited: Net Revenue Share, By Segment, 2017
Figure 18.Lingo24 Limited: Net Revenue Share, By Geography, 2017
Figure 16.Lighthouse IP Group: Net Revenues, 2017-2017 ($Million)
Figure 17.Lighthouse IP Group: Net Revenue Share, By Segment, 2017
Figure 18.Lighthouse IP Group: Net Revenue Share, By Geography, 2017
Figure 16.Lingotek, Inc.: Net Revenues, 2017-2017 ($Million)
Figure 17.Lingotek, Inc.: Net Revenue Share, By Segment, 2017
Figure 18.Lingotek, Inc.: Net Revenue Share, By Geography, 2017
Figure 16.Microsoft Corporation: Net Revenues, 2017-2017 ($Million)
Figure 17.Microsoft Corporation: Net Revenue Share, By Segment, 2017
Figure 18.Microsoft Corporation: Net Revenue Share, By Geography, 2017
Figure 16.Lionbridge Technologies, Inc.: Net Revenues, 2017-2017 ($Million)
Figure 17.Lionbridge Technologies, Inc.: Net Revenue Share, By Segment, 2017
Figure 18.Lionbridge Technologies, Inc.: Net Revenue Share, By Geography, 2017
Research Methodology
We use both primary as well as secondary research for our market surveys, estimates and for developing forecast. Our research process commence by analyzing the problem which enable us to design the scope for our research study. Our research process is uniquely designed with enough flexibility to adjust according to changing nature of products and markets, while retaining core element to ensure reliability and accuracy in research findings. We understand both macro and micro-economic factors to evaluate and forecast different market segments.
Data Mining
Data is extensively collected through various secondary sources such as annual reports, investor presentations, SEC filings, and other corporate publications. We also refer trade magazines, technical journals, paid databases such as Factiva and Bloomberg, industry trade journals, scientific journals, and social media data to understand market dynamics and industry trends. Further, we also conduct primary research to understand market drivers, restraints, opportunities, challenges, and competitive scenario to build our analysis.
Data Collection Matrix
|
Data Collection Matrix |
Supply Side |
Demand Side |
|
Primary Data Sources |
|
|
|
Secondary Data Sources |
|
|
Market Modeling and Forecasting
We use epidemiology and capital equipment-based models to forecast market size of different segments at country and regional level.
- Epidemiology-based Forecasting Model: This method uses epidemiology data gathered through various publications and from physicians to estimate population of patients, flow of treatment of individual disease and therapies. The data collected through this method includes statics on incidence of disease, population suffering from disease, and treatment population. This method is used to understand:
- Number of patients for particular device or medical procedure and
- Repeated use of particular device depending on health and condition of patient
- Capital-based Forecasting Model: This method of forecasting is based on number of replacements, installed-based and new sales of capital equipment used in various healthcare and diagnostic centers. These three parameters are calculated and forecast is developed. Installation base is calculated as average number of units per facility; while sales for particular year is calculated from number of new and replace units. Secondary data is collected through various supply chain intermediaries and opinion leaders to arrive at installation and sales rate. These techniques help our analysts in validating market and developed market estimates and forecast.
We do forecast on basis of several parameters such as market drivers, market opportunities, industry trends government regulations, raw materials supply and trade dynamics to ensure relevance of forecast with market scenario. With increasing need to granulized information, we used bottom-up methodology for forecasting where we evaluate each regional segment differently and combined all forecast to develop final market forecast.
Data Validation
We believe primary research is a very important tool in analyzing and forecasting different markets. In order to make sure accuracy of our findings, our team conducts primary interviews at every stage of research to gain deep insights into current business environment and future trends and key developments in market. This includes use of various methods such as telephonic interviews, focus groups, face to face interviews and questionnaires to validate our research from all aspects. We validate our data through primary research from key industry leaders such as CEO, product managers, marketing managers, suppliers, distributors, and consumers are frequently interviewed. These interviews provide valuable insights which help us to have better market understanding besides validating our estimates and forecast.
Data Triangulation

Industry Analysis
|
Qualitative Data |
Quantitative Data (2017-2025) |
|
|