Integrated Systems Market By Product, Service and End User- Global Industry Analysis and Forecast to 2022
Published On : November 2017 Pages : 120 Category: Telecom & Wireless Report Code : IC11332
Industry Trend Analysis
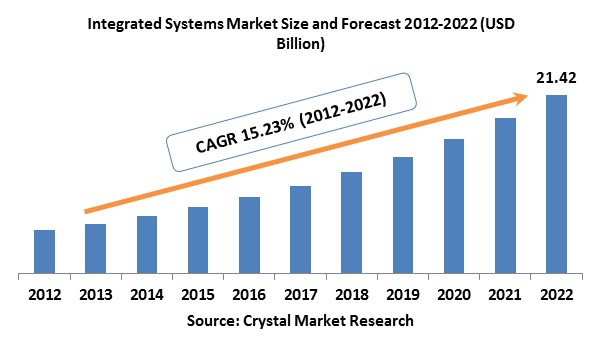
The global integrated systems market was evaluated around USD 5.19 billion in the 2017 and is expected to reach approximately USD 21.42 billion by the end of 2022 while registering itself at a compound annual growth rate (CAGR) of 15.23% over the forecast period. Key storage, networking, systems, and management suppliers are anticipated to have a massive stake in the global integrated systems market as customers are increasingly demanding abbreviated installations and less standalone solutions. Integrated systems need massive investments in channel partnerships, technology, integration, and service delivery. The integrated systems industry is also anticipated to achieve a significant rise in growth as costumers buy solo module performance for delivery of integrated service, influencing a change in phase for data center infrastructure. The IT segment is developing and has experienced a quick change from conventional silos. During the past few years, the market has witnessed the egression of integrated systems; in which data center technologies are merged into tested and pre-engineered systems to function as a unit. The fundamental principles for the abovementioned trend are the need to diminish Total Cost of Ownership (TCO), reduce risk, and enhance productivity. IT executives are gradually counting integrated systems as a proficient way to amend business legerity. IT companies concentrate on adoption of integrated systems in an attempt to increase IT operational efficiency and staff productivity and sustain on-demand IT infrastructure, which is anticipated to speed up the growth of integrated systems market during the forecast years.
Product Outlook and Trend Analysis
Integrated systems are also adverted to converged infrastructure. They are validated, tested and pre-integrated systems that mostly include integrated platform systems as well as integrated infrastructure. Integrated platform is basically sold with supplementary pre-integrated modified system technology and packaged software developed to allow functions like application development, storage, integration and testing tools like databases, application development software, integration, and testing tools; while integrated infrastructure comprehends network, server, and storage incorporated to render shared infrastructure. The integrated infrastructure market might go beyond the integrated platform section during the forecast years, and sequentially boost the growth of the global integrated systems market.
Service Outlook and Trend Analysis
Integrated systems service section involves the provision of consulting, integration and installation and support & maintenance. As the name indicates, integration and installation services involve execution and initiate with analyzing organizational silos, counting storage facilities, servers, and networking which can be effortlessly combined with the earlier infrastructure for optimizing IT performance of the company. The section is anticipated to experience elevated growth during the coming years, which could be assigned to high requirement over numerous large-scale, medium and small companies. Consulting services involve understanding user needs and purveying a plan to assemble and controlled integrated systems providing numerous IT requirements of an organization. Support and maintenance services involve any after-sales services, and preventive maintenance contracts or yearly maintenance contracts.
End-user Outlook and Trend Analysis
The integrated systems are traded to consumers in several domains, which are healthcare, educational institutes, manufacturing, retail, telecom & IT and BFSI. Concerning revenue, IT & telecom and BFSI are anticipated to appear as a leading section due to high acceptance rate over these industries. Manufacturing and retail section provides numerous growth opportunities for the global market and might experience speedy growth during the forecast years.
Regional Outlook and Trend Analysis
The North American regional market is anticipated to come out as the leading regional market due to technological innovations and elevated infiltration in integrated systems market. Also, the existence of Amazon and Facebook that have effectively adopted integrated systems architecture might also propel the regional market demand for integrated systems during the forecast years. Asia Pacific regional market is anticipated to experience extensive growth during the projected period. This could be mainly assigned to data center transformation projects along with the speedy development of IT infrastructure in the region. Considering the steady improvement observed over major countries worldwide during the past few years, purchaser confidence in installing integrated systems is likely to demonstrate significant demand.
Competitive Outlook and Trend Analysis
In 2017, the global integrated systems market is extremely fused with key players reporting for a significant market share. The major market players are Hewlett and Packard (HP), IBM, Oracle Corporation, VCE, and Cisco Systems. Companies frequently offer maintenance services for the device distributed in the customer’s area. Integrated system suppliers are associating with both virtualization and cloud-based storage providers to increase the installation of the converged infrastructure in the organization.
The global integrated systems market is segmented as follows –
By Product
- Integrated Platform/Workload Systems
- Integrated Infrastructure Systems
By Service
- Integration & Installation
- Consulting
- Maintenance & Support
By End-user
- BFSI
- IT & Telecom
- Retail
- Manufacturing
- Healthcare
- Others
By Region
- North America
- U.S
- Canada
- Mexico
- Europe
- Germany
- France
- UK
- Italy
- Spain
- Rest of Europe
- Asia-Pacific
- Japan
- China
- Australia
- India
- South Korea
- Rest of Asia Pacific
- Rest of the World
- Brazil
- South Africa
- Saudi Arabia
- United Arab Emirates
- Others
Some of the key questions answered by the report are:
· What was the market size in 2017 and forecast from 2017 to 2022?
· What will be the industry market growth from 2017 to 2022?
· What are the major drivers, restraints, opportunities, challenges, and industry trends and their impact on the market forecast?
· What are the major segments leading the market growth and why?
· Which are the leading players in the market and what are the major strategies adopted by them to sustain the market competition?
- Integrated Systems Market, By Product, Estimates and Forecast, 2012-2022 ($Billion)
- Integrated Platform/Workload Systems
- Integrated Infrastructure Systems
- Integrated Systems Market, By Service, Estimates and Forecast, 2012-2022 ($Billion)
- Integration & Installation
- Consulting
- Maintenance & Support
- Integrated Systems Market, By End User, Estimates and Forecast, 2012-2022 ($Billion)
- BFSI
- IT & Telecom
- Retail
- Manufacturing
- Healthcare
- Others
- Integrated Systems Market, By Region, Estimates and Forecast, 2012-2022 ($Billion)
- North America
- North America Integrated Systems Market, By Country
- North America Integrated Systems Market, By Product
- North America Integrated Systems Market, By Service
- North America Integrated Systems Market, By End User
- U.S. Integrated Systems Market, By Product
- U.S. Integrated Systems Market, By Service
- U.S. Integrated Systems Market, By End User
- Canada Integrated Systems Market, By Product
- Canada Integrated Systems Market, By Service
- Canada Integrated Systems Market, By End User
- Mexico Integrated Systems Market, By Product
- Mexico Integrated Systems Market, By Service
- Mexico Integrated Systems Market, By End User
-
- Europe
- Europe Integrated Systems Market, By Country
- Europe Integrated Systems Market, By Product
- Europe Integrated Systems Market, By Service
- Europe Integrated Systems Market, By End User
- Germany Integrated Systems Market, By Product
- Germany Integrated Systems Market, By Service
- Germany Integrated Systems Market, By End User
- France Integrated Systems Market, By Product
- France Integrated Systems Market, By Service
- France Integrated Systems Market, By End User
- UK Integrated Systems Market, By Product
- UK Integrated Systems Market, By Service
- UK Integrated Systems Market, By End User
- Italy Integrated Systems Market, By Product
- Italy Integrated Systems Market, By Service
- Italy Integrated Systems Market, By End User
- Spain Integrated Systems Market, By Product
- Spain Integrated Systems Market, By Service
- Spain Integrated Systems Market, By End User
- Rest of Europe Integrated Systems Market, By Product
- Rest of Europe Integrated Systems Market, By Service
- Rest of Europe Integrated Systems Market, By End User
-
- Asia-Pacific
- Asia-Pacific Integrated Systems Market, By Country
- Asia-Pacific Integrated Systems Market, By Product
- Asia-Pacific Integrated Systems Market, By Service
- Asia-Pacific Integrated Systems Market, By End User
- Japan Integrated Systems Market, By Product
- Japan Integrated Systems Market, By Service
- Japan Integrated Systems Market, By End User
- Australia Integrated Systems Market, By Product
- Australia Integrated Systems Market, By Service
- Australia Integrated Systems Market, By End User
- India Integrated Systems Market, By Product
- India Integrated Systems Market, By Service
- India Integrated Systems Market, By End User
- South Korea Integrated Systems Market, By Product
- South Korea Integrated Systems Market, By Service
- South Korea Integrated Systems Market, By End User
- Rest of Asia-Pacific Integrated Systems Market, By Product
- Rest of Asia-Pacific Integrated Systems Market, By Service
- Rest of Asia-Pacific Integrated Systems Market, By End User
-
- Rest of the World
- Rest of the World Integrated Systems Market, By Country
- Rest of the World Integrated Systems Market, By Product
- Rest of the World Integrated Systems Market, By Service
- Rest of the World Integrated Systems Market, By End User
- Brazil Integrated Systems Market, By Product
- Brazil Integrated Systems Market, By Service
- Brazil Integrated Systems Market, By End User
- South Africa Integrated Systems Market, By Product
- South Africa Integrated Systems Market, By Service
- South Africa Integrated Systems Market, By End User
- Saudi Arabia Integrated Systems Market, By Product
- Saudi Arabia Integrated Systems Market, By Service
- Saudi Arabia Integrated Systems Market, By End User
- Turkey Integrated Systems Market, By Product
- Turkey Integrated Systems Market, By Service
- Turkey Integrated Systems Market, By End User
- United Arab Emirates Integrated Systems Market, By Product
- United Arab Emirates Integrated Systems Market, By Service
- United Arab Emirates Integrated Systems Market, By End User
- Others Integrated Systems Market, By Product
- Others Integrated Systems Market, By Service
- Others Integrated Systems Market, By End User
1. Introduction
1.1. Report Description
1.2. Research Methodology
1.2.1. Secondary Research
1.2.2. Primary Research
2. Executive Summary
2.1. Key Highlights
3. Market Overview
3.1. Introduction
3.1.1. Market Definition
3.1.2. Market Segmentation
3.2. Market Dynamics
3.2.1. Drivers
3.2.1.1. Concern for Automation and Integrated Approach in Business Process
3.2.1.2. Advancements in Cloud Technologies and Virtualization
3.2.2. Restraints
3.2.2.1. High Implementation of Cost and Time
3.2.2.2. Absence of Standardize Framework
3.2.3. Opportunities
3.2.3.1. Emerging Markets to Offer Lucrative Growth Opportunities
4. Integrated Systems Market, By Product
4.1. Introduction
4.2. Integrated Systems Market Assessment and Forecast, By Product, 2012-2022
4.3. Integrated Platform/Workload Systems
4.3.1. Market Assessment and Forecast, By Region, 2012-2022 ($Billion)
4.4. Integrated Infrastructure Systems
4.4.1. Market Assessment and Forecast, By Region, 2012-2022 ($Billion)
5. Integrated Systems Market, By Service
5.1. Introduction
5.2. Integrated Systems Market Assessment and Forecast, By Service, 2012-2022
5.3. Integration & Installation
5.3.1. Market Assessment and Forecast, By Region, 2012-2022 ($Billion)
5.4. Consulting
5.4.1. Market Assessment and Forecast, By Region, 2012-2022 ($Billion)
5.5. Maintenance & Support
5.5.1. Market Assessment and Forecast, By Region, 2012-2022 ($Billion)
6. Integrated Systems Market, By End User
6.1. Introduction
6.2. Integrated Systems Market Assessment and Forecast, By End User, 2012-2022 ($Billion)
6.3. BFSI
6.3.1. Market Assessment and Forecast, By Region, 2012-2022 ($Billion)
6.4. IT & Telecom
6.4.1. Market Assessment and Forecast, By Region, 2012-2022 ($Billion)
6.5. Retail
6.5.1. Market Assessment and Forecast, By Region, 2012-2022 ($Billion)
6.6. Manufacturing
6.6.1. Market Assessment and Forecast, By Region, 2012-2022 ($Billion)
6.7. Healthcare
6.7.1. Market Assessment and Forecast, By Region, 2012-2022 ($Billion)
6.8. Other End Users
6.8.1. Market Assessment and Forecast, By Region, 2012-2022 ($Billion)
7. Integrated Systems Market, By Region
7.1. Introduction
7.2. Integrated Systems Market Assessment and Forecast, By Region, 2012-2022 ($Billion)
7.3. North America
7.3.1. Market Assessment and Forecast, By Country, 2012-2022 ($Billion)
7.3.2. Market Assessment and Forecast, By Product, 2012-2022 ($Billion)
7.3.3. Market Assessment and Forecast, By Service, 2012-2022 ($Billion)
7.3.4. Market Assessment and Forecast, By End User, 2012-2022 ($Billion)
7.3.5. U.S.
7.3.5.1.1. Market Assessment and Forecast, By Product, 2012-2022 ($Billion)
7.3.5.1.2. Market Assessment and Forecast, By Service, 2012-2022 ($Billion)
7.3.5.1.3. Market Assessment and Forecast, By End User, 2012-2022 ($Billion)
7.3.5.2. Canada
7.3.5.2.1. Market Assessment and Forecast, By Product, 2012-2022 ($Billion)
7.3.5.2.2. Market Assessment and Forecast, By Service, 2012-2022 ($Billion)
7.3.5.2.3. Market Assessment and Forecast, By End User, 2012-2022 ($Billion)
7.3.5.3. Mexico
7.3.5.3.1. Market Assessment and Forecast, By Product, 2012-2022 ($Billion)
7.3.5.3.2. Market Assessment and Forecast, By Service, 2012-2022 ($Billion)
7.3.5.3.3. Market Assessment and Forecast, By End User, 2012-2022 ($Billion)
7.4. Europe
7.4.1. Market Assessment and Forecast, By Country, 2012-2022 ($Billion)
7.4.2. Market Assessment and Forecast, By Product, 2012-2022 ($Billion)
7.4.3. Market Assessment and Forecast, By Service, 2012-2022 ($Billion)
7.4.4. Market Assessment and Forecast, By End User, 2012-2022 ($Billion)
7.4.5. Germany
7.4.5.1.1. Market Assessment and Forecast, By Product, 2012-2022 ($Billion)
7.4.5.1.2. Market Assessment and Forecast, By Service, 2012-2022 ($Billion)
7.4.5.1.3. Market Assessment and Forecast, By End User, 2012-2022 ($Billion)
7.4.6. France
7.4.6.1.1. Market Assessment and Forecast, By Product, 2012-2022 ($Billion)
7.4.6.1.2. Market Assessment and Forecast, By Service, 2012-2022 ($Billion)
7.4.6.1.3. Market Assessment and Forecast, By End User, 2012-2022 ($Billion)
7.4.7. UK
7.4.7.1.1. Market Assessment and Forecast, By Product, 2012-2022 ($Billion)
7.4.7.1.2. Market Assessment and Forecast, By Service, 2012-2022 ($Billion)
7.4.7.1.3. Market Assessment and Forecast, By End User, 2012-2022 ($Billion)
7.4.8. Italy
7.4.8.1.1. Market Assessment and Forecast, By Product, 2012-2022 ($Billion)
7.4.8.1.2. Market Assessment and Forecast, By Service, 2012-2022 ($Billion)
7.4.8.1.3. Market Assessment and Forecast, By End User, 2012-2022 ($Billion)
7.4.9. Spain
7.4.9.1.1. Market Assessment and Forecast, By Product, 2012-2022 ($Billion)
7.4.9.1.2. Market Assessment and Forecast, By Service, 2012-2022 ($Billion)
7.4.9.1.3. Market Assessment and Forecast, By End User, 2012-2022 ($Billion)
7.4.9.2. Rest of Europe
7.4.9.2.1. Market Assessment and Forecast, By Product, 2012-2022 ($Billion)
7.4.9.2.2. Market Assessment and Forecast, By Service, 2012-2022 ($Billion)
7.4.9.2.3. Market Assessment and Forecast, By End User, 2012-2022 ($Billion)
8. Asia-Pacific
8.1.1. Market Assessment and Forecast, By Country, 2012-2022 ($Billion)
8.1.2. Market Assessment and Forecast, By Product, 2012-2022 ($Billion)
8.1.3. Market Assessment and Forecast, By Service, 2012-2022 ($Billion)
8.1.4. Market Assessment and Forecast, By End User, 2012-2022 ($Billion)
8.1.4.1. Japan
8.1.4.1.1. Market Assessment and Forecast, By Product, 2012-2022 ($Billion)
8.1.4.1.2. Market Assessment and Forecast, By Service, 2012-2022 ($Billion)
8.1.4.1.3. Market Assessment and Forecast, By End User, 2012-2022 ($Billion)
8.1.5. China
8.1.5.1.1. Market Assessment and Forecast, By Product, 2012-2022 ($Billion)
8.1.5.1.2. Market Assessment and Forecast, By Service, 2012-2022 ($Billion)
8.1.5.1.3. Market Assessment and Forecast, By End User, 2012-2022 ($Billion)
8.1.6. Australia
8.1.6.1.1. Market Assessment and Forecast, By Product, 2012-2022 ($Billion)
8.1.6.1.2. Market Assessment and Forecast, By Service, 2012-2022 ($Billion)
8.1.6.1.3. Market Assessment and Forecast, By End User, 2012-2022 ($Billion)
8.1.7. India
8.1.7.1.1. Market Assessment and Forecast, By Product, 2012-2022 ($Billion)
8.1.7.1.2. Market Assessment and Forecast, By Service, 2012-2022 ($Billion)
8.1.7.1.3. Market Assessment and Forecast, By End User, 2012-2022 ($Billion)
8.1.8. South Korea
8.1.8.1.1. Market Assessment and Forecast, By Product, 2012-2022 ($Billion)
8.1.8.1.2. Market Assessment and Forecast, By Service, 2012-2022 ($Billion)
8.1.8.1.3. Market Assessment and Forecast, By End User, 2012-2022 ($Billion)
8.1.9. Rest of Asia-Pacific
8.1.9.1.1. Market Assessment and Forecast, By Product, 2012-2022 ($Billion)
8.1.9.1.2. Market Assessment and Forecast, By Service, 2012-2022 ($Billion)
8.1.9.1.3. Market Assessment and Forecast, By End User, 2012-2022 ($Billion)
9. Rest of the World
9.1.1. Market Assessment and Forecast, By Country, 2012-2022 ($Billion)
9.1.2. Market Assessment and Forecast, By Product, 2012-2022 ($Billion)
9.1.3. Market Assessment and Forecast, By Service, 2012-2022 ($Billion)
9.1.4. Market Assessment and Forecast, By End User, 2012-2022 ($Billion)
9.1.5. Brazil
9.1.5.1.1. Market Assessment and Forecast, By Product, 2012-2022 ($Billion)
9.1.5.1.2. Market Assessment and Forecast, By Service, 2012-2022 ($Billion)
9.1.5.1.3. Market Assessment and Forecast, By End User, 2012-2022 ($Billion)
9.1.6. Turkey
9.1.6.1.1. Market Assessment and Forecast, By Product, 2012-2022 ($Billion)
9.1.6.1.2. Market Assessment and Forecast, By Service, 2012-2022 ($Billion)
9.1.6.1.3. Market Assessment and Forecast, By End User, 2012-2022 ($Billion)
9.1.7. Saudi Arabia
9.1.7.1.1. Market Assessment and Forecast, By Product, 2012-2022 ($Billion)
9.1.7.1.2. Market Assessment and Forecast, By Service, 2012-2022 ($Billion)
9.1.7.1.3. Market Assessment and Forecast, By End User, 2012-2022 ($Billion)
9.1.8. South Africa
9.1.8.1.1. Market Assessment and Forecast, By Product, 2012-2022 ($Billion)
9.1.8.1.2. Market Assessment and Forecast, By Service, 2012-2022 ($Billion)
9.1.8.1.3. Market Assessment and Forecast, By End User, 2012-2022 ($Billion)
9.1.9. United Arab Emirates
9.1.9.1.1. Market Assessment and Forecast, By Product, 2012-2022 ($Billion)
9.1.9.1.2. Market Assessment and Forecast, By Service, 2012-2022 ($Billion)
9.1.9.1.3. Market Assessment and Forecast, By End User, 2012-2022 ($Billion)
9.1.10. Others
9.1.10.1.1. Market Assessment and Forecast, By Product, 2012-2022 ($Billion)
9.1.10.1.2. Market Assessment and Forecast, By Service, 2012-2022 ($Billion)
9.1.10.1.3. Market Assessment and Forecast, By End User, 2012-2022 ($Billion)
10. Company Profiles
10.1. Accenture
10.1.1. Business Overview
10.1.2. Product Portfolio
10.1.3. Key Financials
10.1.4. Strategic Developments
10.2. Cap Gemini
10.2.1. Business Overview
10.2.2. Product Portfolio
10.2.3. Key Financials
10.2.4. Strategic Developments
10.3. Cisco Inc.
10.3.1. Business Overview
10.3.2. Product Portfolio
10.3.3. Key Financials
10.3.4. Strategic Developments
10.4. CSC
10.4.1. Business Overview
10.4.2. Product Portfolio
10.4.3. Strategic Developments
10.5. Deloitte
10.5.1. Business Overview
10.5.2. Product Portfolio
10.5.3. Strategic Developments
10.6. EMC
10.6.1. Business Overview
10.6.2. Product Portfolio
10.6.3. Strategic Developments
10.7. Fujitsu
10.7.1. Business Overview
10.7.2. Product Portfolio
10.7.3. Strategic Developments
10.8. Hitachi
10.8.1. Business Overview
10.8.2. Product Portfolio
10.8.3. Strategic Developments
10.9. HP
10.9.1. Business Overview
10.9.2. Product Portfolio
10.9.3. Strategic Developments
10.10. Huawei
10.10.1. Business Overview
10.10.2. Product Portfolio
10.10.3. Strategic Developments
10.11. IBM
10.11.1. Business Overview
10.11.2. Product Portfolio
10.11.3. Key Financials
10.11.4. Strategic Developments
List of Tables
Table 1.Integrated Systems Market, By Product ($Billion), 2012-2022
Table 2.Integrated Platform/Workload Systems Market, By Region ($Billion), 2012-2022
Table 3.Integrated Infrastructure Systems Market, By Region ($Billion), 2012-2022
Table 4.Integrated Systems Market, By Service ($Billion), 2012-2022
Table 5.Integration & Installation Market, By Region ($Billion), 2012-2022
Table 6.Consulting Market, By Region ($Billion), 2012-2022
Table 7.Maintenance & Support Market, By Region ($Billion), 2012-2022
Table 8.Integrated Systems Market, By End User ($Billion), 2012-2022
Table 9.BFSI Market, By Region ($Billion), 2012-2022
Table 10.IT & Telecom Market, By Region ($Billion), 2012-2022
Table 11.Retail Systems Market, By Region ($Billion), 2012-2022
Table 12.Manufacturing Market, By Region ($Billion), 2012-2022
Table 13.Healthcare Market, By Region ($Billion), 2012-2022
Table 14.Other End User Market, By Region ($Billion), 2012-2022
Table 15.North America Integrated Systems Market, By Country, 2012-2022 ($Billion)
Table 16.North America Integrated Systems Market, By Product, 2012-2022 ($Billion)
Table 17.North America Integrated Systems Market, By Service, 2012-2022 ($Billion)
Table 18.North America Integrated Systems Market, By End User, 2012-2022 ($Billion)
Table 19.U.S. Integrated Systems Market, By Product, 2012-2022 ($Billion)
Table 20.U.S. Integrated Systems Market, By Service, 2012-2022 ($Billion)
Table 21.U.S. Integrated Systems Market, By End User, 2012-2022 ($Billion)
Table 22.Canada Integrated Systems Market, By Product, 2012-2022 ($Billion)
Table 23.Canada Integrated Systems Market, By Service, 2012-2022 ($Billion)
Table 24.Canada Integrated Systems Market, By End User, 2012-2022 ($Billion)
Table 25.Mexico Integrated Systems Market, By Product, 2012-2022 ($Billion)
Table 26.Mexico Integrated Systems Market, By Service, 2012-2022 ($Billion)
Table 27.Mexico Integrated Systems Market, By End User, 2012-2022 ($Billion)
Table 28.Europe Integrated Systems Market, By Country, 2012-2022 ($Billion)
Table 29.Europe Integrated Systems Market, By Product, 2012-2022 ($Billion)
Table 30.Europe Integrated Systems Market, By Service, 2012-2022 ($Billion)
Table 31.Europe Integrated Systems Market, By End User, 2012-2022 ($Billion)
Table 32.Germany Integrated Systems Market, By Product, 2012-2022 ($Billion)
Table 33.Germany Integrated Systems Market, By Service, 2012-2022 ($Billion)
Table 34.Germany Integrated Systems Market, By End User, 2012-2022 ($Billion)
Table 35.France Integrated Systems Market, By Product, 2012-2022 ($Billion)
Table 36.France Integrated Systems Market, By Service, 2012-2022 ($Billion)
Table 37.France Integrated Systems Market, By End User, 2012-2022 ($Billion)
Table 38.UK Integrated Systems Market, By Product, 2012-2022 ($Billion)
Table 39.UK Integrated Systems Market, By Service, 2012-2022 ($Billion)
Table 40.UK Integrated Systems Market, By End User, 2012-2022 ($Billion)
Table 41.Italy Integrated Systems Market, By Product, 2012-2022 ($Billion)
Table 42.Italy Integrated Systems Market, By Service, 2012-2022 ($Billion)
Table 44.Italy Integrated Systems Market, By End User, 2012-2022 ($Billion)
Table 45.Spain Integrated Systems Market, By Product, 2012-2022 ($Billion)
Table 46.Spain Integrated Systems Market, By Service, 2012-2022 ($Billion)
Table 47.Spain Integrated Systems Market, By End User, 2012-2022 ($Billion)
Table 48.Rest of Europe Integrated Systems Market, By Product, 2012-2022 ($Billion)
Table 49.Rest of Europe Integrated Systems Market, By Service, 2012-2022 ($Billion)
Table 50.Rest of Europe Integrated Systems Market, By End User, 2012-2022 ($Billion)
Table 51.Asia-Pacific Integrated Systems Market, By Country, 2012-2022 ($Billion)
Table 52.Asia-Pacific Integrated Systems Market, By Product, 2012-2022 ($Billion)
Table 53.Asia-Pacific Integrated Systems Market, By Service, 2012-2022 ($Billion)
Table 54.Asia-Pacific Integrated Systems Market, By End User, 2012-2022 ($Billion)
Table 55.Japan Integrated Systems Market, By Product, 2012-2022 ($Billion)
Table 56.Japan Integrated Systems Market, By Service, 2012-2022 ($Billion)
Table 57.Japan Integrated Systems Market, By End User, 2012-2022 ($Billion)
Table 58.China Integrated Systems Market, By Product, 2012-2022 ($Billion)
Table 59.China Integrated Systems Market, By Service, 2012-2022 ($Billion)
Table 60.China Integrated Systems Market, By End User, 2012-2022 ($Billion)
Table 61.Australia Integrated Systems Market, By Product, 2012-2022 ($Billion)
Table 62.Australia Integrated Systems Market, By Service, 2012-2022 ($Billion)
Table 63.Australia Integrated Systems Market, By End User, 2012-2022 ($Billion)
Table 64.India Integrated Systems Market, By Product, 2012-2022 ($Billion)
Table 65.India Integrated Systems Market, By Service, 2012-2022 ($Billion)
Table 66.India Integrated Systems Market, By End User, 2012-2022 ($Billion)
Table 67.South Korea Integrated Systems Market, By Product, 2012-2022 ($Billion)
Table 68.South Korea Integrated Systems Market, By Service, 2012-2022 ($Billion)
Table 69.South Korea Integrated Systems Market, By End User, 2012-2022 ($Billion)
Table 70.Rest of Asia-Pacific Integrated Systems Market, By Product, 2012-2022 ($Billion)
Table 71.Rest of Asia-Pacific Integrated Systems Market, By Service, 2012-2022 ($Billion)
Table 72.Rest of Asia-Pacific Integrated Systems Market, By End User, 2012-2022 ($Billion)
Table 73.Rest of the World Integrated Systems Market, By Country, 2012-2022 ($Billion)
Table 74.Rest of the World Integrated Systems Market, By Product, 2012-2022 ($Billion)
Table 75.Rest of the World Integrated Systems Market, By Service, 2012-2022 ($Billion)
Table 76.Rest of the World Integrated Systems Market, By End User, 2012-2022 ($Billion)
Table 77.Brazil Integrated Systems Market, By Product, 2012-2022 ($Billion)
Table 78.Brazil Integrated Systems Market, By Service, 2012-2022 ($Billion)
Table 79.Brazil Integrated Systems Market, By End User, 2012-2022 ($Billion)
Table 80.Turkey Integrated Systems Market, By Product, 2012-2022 ($Billion)
Table 81.Turkey Integrated Systems Market, By Service, 2012-2022 ($Billion)
Table 82.Turkey Integrated Systems Market, By End User, 2012-2022 ($Billion)
Table 83.Saudi Arabia Integrated Systems Market, By Product, 2012-2022 ($Billion)
Table 84.Saudi Arabia Integrated Systems Market, By Service, 2012-2022 ($Billion)
Table 85.Saudi Arabia Integrated Systems Market, By End User, 2012-2022 ($Billion)
Table 86.South Africa Integrated Systems Market, By Product, 2012-2022 ($Billion)
Table 87.South Africa Integrated Systems Market, By Service, 2012-2022 ($Billion)
Table 88.South Africa Integrated Systems Market, By End User, 2012-2022 ($Billion)
Table 89.United Arab Emirates Integrated Systems Market, By Product, 2012-2022 ($Billion)
Table 90.United Arab Emirates Integrated Systems Market, By Service, 2012-2022 ($Billion)
Table 91.United Arab Emirates Integrated Systems Market, By End User, 2012-2022 ($Billion)
Table 92.Others Integrated Systems Market, By Product, 2012-2022 ($Billion)
Table 93.Others Integrated Systems Market, By Service, 2012-2022 ($Billion)
Table 94.Others Integrated Systems Market, By End User, 2012-2022 ($Billion)
Table 95.Accenture: Key Strategic Developments, 2017-2017
Table 96.Cap Gemini: Key Strategic Developments, 2017-2017
Table 97.Cisco Inc.: Key Strategic Developments, 2017-2017
Table 98.CSC: Key Strategic Developments, 2017-2017
Table 99.Deloitte: Key Strategic Developments, 2017-2017
Table 100.EMC: Key Strategic Developments, 2017-2017
Table 101.Fujitsu: Key Strategic Developments, 2017-2017
Table 102.Hitachi: Key Strategic Developments, 2017-2017
Table 103.HP: Key Strategic Developments, 2017-2017
Table 104.Huawei: Key Strategic Developments, 2017-2017
Table 105.IBM: Key Strategic Developments, 2017-2017
List of Figures
Figure 1.Integrated Systems Market Share, By Product, 2017 & 2025 ($Billion)
Figure 2.Integrated Systems Market, By Service, 2017 & 2025 ($Billion)
Figure 3.Integrated Systems Market, By End User, 2017 & 2025 ($Billion)
Figure 4.Integrated Systems Market, By Region, 2017, ($Billion)
Figure 5.Accenture: Net Revenues, 2017-2017 ($Billion)
Figure 6.Accenture: Net Revenue Share, By Segment, 2017
Figure 7.Accenture: Net Revenue Share, By Geography, 2017
Figure 8.Cap Gemini: Net Revenues, 2017-2017 ($Billion)
Figure 9.Cap Gemini: Net Revenue Share, By Segment, 2017
Figure 10.Cap Gemini: Net Revenue Share, By Geography, 2017
Figure 11.Cisco Inc.: Net Revenues, 2017-2017 ($Billion)
Figure 12.Cisco Inc.: Net Revenue Share, By Segment, 2017
Figure 13.Cisco Inc.: Net Revenue Share, By Geography, 2017
Figure 14.IBM: Net Revenues, 2017-2017 ($Billion)
Figure 15.IBM: Net Revenue Share, By Segment, 2017
Figure 16.IBM: Net Revenue Share, By Geography, 2017
Research Methodology
We use both primary as well as secondary research for our market surveys, estimates and for developing forecast. Our research process commence by analyzing the problem which enable us to design the scope for our research study. Our research process is uniquely designed with enough flexibility to adjust according to changing nature of products and markets, while retaining core element to ensure reliability and accuracy in research findings. We understand both macro and micro-economic factors to evaluate and forecast different market segments.
Data Mining
Data is extensively collected through various secondary sources such as annual reports, investor presentations, SEC filings, and other corporate publications. We also refer trade magazines, technical journals, paid databases such as Factiva and Bloomberg, industry trade journals, scientific journals, and social media data to understand market dynamics and industry trends. Further, we also conduct primary research to understand market drivers, restraints, opportunities, challenges, and competitive scenario to build our analysis.
Data Collection Matrix
|
Data Collection Matrix |
Supply Side |
Demand Side |
|
Primary Data Sources |
|
|
|
Secondary Data Sources |
|
|
Market Modeling and Forecasting
We use epidemiology and capital equipment-based models to forecast market size of different segments at country and regional level.
- Epidemiology-based Forecasting Model: This method uses epidemiology data gathered through various publications and from physicians to estimate population of patients, flow of treatment of individual disease and therapies. The data collected through this method includes statics on incidence of disease, population suffering from disease, and treatment population. This method is used to understand:
- Number of patients for particular device or medical procedure and
- Repeated use of particular device depending on health and condition of patient
- Capital-based Forecasting Model: This method of forecasting is based on number of replacements, installed-based and new sales of capital equipment used in various healthcare and diagnostic centers. These three parameters are calculated and forecast is developed. Installation base is calculated as average number of units per facility; while sales for particular year is calculated from number of new and replace units. Secondary data is collected through various supply chain intermediaries and opinion leaders to arrive at installation and sales rate. These techniques help our analysts in validating market and developed market estimates and forecast.
We do forecast on basis of several parameters such as market drivers, market opportunities, industry trends government regulations, raw materials supply and trade dynamics to ensure relevance of forecast with market scenario. With increasing need to granulized information, we used bottom-up methodology for forecasting where we evaluate each regional segment differently and combined all forecast to develop final market forecast.
Data Validation
We believe primary research is a very important tool in analyzing and forecasting different markets. In order to make sure accuracy of our findings, our team conducts primary interviews at every stage of research to gain deep insights into current business environment and future trends and key developments in market. This includes use of various methods such as telephonic interviews, focus groups, face to face interviews and questionnaires to validate our research from all aspects. We validate our data through primary research from key industry leaders such as CEO, product managers, marketing managers, suppliers, distributors, and consumers are frequently interviewed. These interviews provide valuable insights which help us to have better market understanding besides validating our estimates and forecast.
Data Triangulation

Industry Analysis
|
Qualitative Data |
Quantitative Data (2017-2025) |
|
|