Hyaluronic Acid Market by Product and Application - Global Industry Analysis and Forecast to 2022
Published On : November 2017 Pages : 160 Category: In-Vitro Diagnostics Report Code : HC11323
Industry Trend Analysis
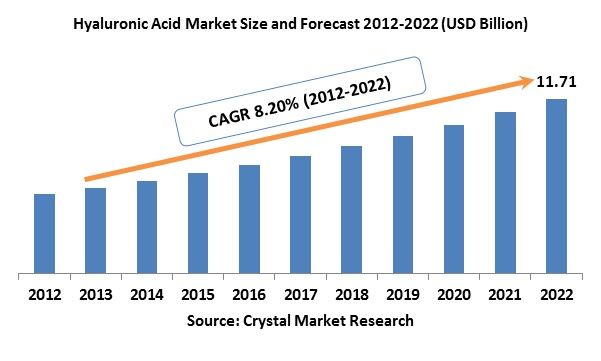
The global hyaluronic acids market was evaluated around USD 5.32 billion in the 2017 and is expected to reach approximately USD 11.71 billion by the end of 2022 while registering itself at a compound annual growth rate (CAGR) of 8.20% over the forecast period. Rising utilization of hyaluronic acid for treating mouth sores, aging skin, and dry eyes is anticipated to impact the growth of the global market positively over the projected period. The elevated growth is expected owing to rising number of people preferring the cosmetic nonsurgical procedures, encouraging reimbursement policies and also increasing the geriatric population. Growing awareness regarding health and shifting beauty measures have contributed to rising demand for aesthetics and cosmetics procedures. The quick growth of geriatric population along with the considerable rise of the disease conditions like dry eyes, ulcers, and osteoarthritis are the major factors fueling the demand. Viscosupplements are tiny doses of hyaluronic acids introduced in the joints to enhance lubrication with the aim of assisting the movement. Although in pain management the market share of painkillers is elevated, viscosupplements are acquiring popularity as a treatment. The global market is experiencing advent of innovative technology as well as geographical growth via mergers & acquisitions and drugs approvals completed by the market giants.
Product Outlook and Trend Analysis
On the basis of products, the global market is divided into, single-injection, three-injection, and five-injection cycles. In 2017, the five-injection cycle reported for the major market share. The hyaluronic acid dosage is introduced to synovial fluid of hip and knee to make movement easy and relieve joint pain. These dosages are taken in the period of 3 to 5 weeks according to the severity of disease and condition of the patient. The doses are separated to permit patients to recuperate from the modest side effects, like swelling and redness at the injection site. Anika Therapeutics, Inc. introduced its recently sanctioned viscosupplement, Cignal in March 2017. This novel product is a blend of steroids and viscosupplement, which helps to ease the knee pain. The single injection cycle is expected to be the highest growing section. This is assigned to the choice of patients to minimize treatment duration and rapid results. Market players are also launching innovative products and technology to accomplish this demand.
Application Outlook and Trend Analysis
By applications, the global market is classified as osteoarthritis, dermal fillers, vesicoureteral reflux, and ophthalmic. Dermal fillers were the most famous and favored choice for cosmetic treatment concerning the amount of inquiries and experienced a growth of 131% over the last two years. The wish to look youthful and healthy is also supporting men to go for this treatment. This represents the increasing fillers demand and is one of the major driving factors of this section. There is a stable rise in the occurrence of vesicoureteral reflux in last few years owing to the injuries, changed lifestyle, and augmented pace of surgical procedures executed. The ophthalmic section is projected to grow at the highest compound annual growth rate during the forecast years. Major factors bestowing to its growth are; rising occurrence of diseases like glaucoma, cataracts, dry eyes, and age-related macular degeneration. There are over 0.2 million ophthalmologists worldwide. Additionally, lens and cataract procedures are among the top outpatient surgeries in the United States. Also, the occurrence of dry eyes is inflated in the United States with 40 million patients. This renders a massive opportunity for growth of ophthalmology-related applications of the products based on hyaluronic acid.
Regional Outlook and Trend Analysis
North American regional market reported for the highest revenue share of around 40% in 2017. The United States is the most vital market and reports for most of the North American market share. The regional population is more aware regarding aging and is ready to implement new therapeutics methods. Asia Pacific regional market is anticipated to come out as the highest growing region during the forecast years. Japan is amongst the highest contributors to the Asia Pacific regional market revenue, due to its huge aged population and rising awareness among the population about esthetics.
Competitive Outlook and Trend Analysis
The market players for the global Hyaluronic acid market are Sanofi (Genzyme), Allergan, Inc., Salix Pharmaceuticals, Galderma S.A., Seikagaku Corporation, Smith & Nephew Plc, Zimmer Holdings, Inc., F. Hoffmann-La Roche Ltd., Ferring Pharmaceuticals, Inc., and Anika Therapeutics, Inc. The forceful acquisitions done by Valeant Pharmaceuticals in the last couple of years have boosted the shares. Valeant acquired Salix Pharmaceuticals Ltd. in 2017 and an eye care products’ company named as Bausch + Lomb Holdings Inc., earlier in 2017. Furthermore, market participants like Actavis, Rayner, and Galderma have acquired companies to expand their product range and strike into the unfulfilled requirements of the customers. Acquisitions are expected to strengthen the industry dynamics during the projected period.
The global hyaluronic acid market is segmented as follows –
By Product
- Single injection
- Three injection
- Five injection
By Application
- Dermal fillers
- Osteoarthritis
- Ophthalmic
- Vesicoureteral reflux
By Region
- North America
- U.S
- Canada
- Mexico
- Europe
- Germany
- France
- UK
- Italy
- Spain
- Rest of Europe
- Asia-Pacific
- Japan
- China
- Australia
- India
- South Korea
- Rest of Asia Pacific
- Rest of the World
- Brazil
- South Africa
- Saudi Arabia
- United Arab Emirates
- Others
Some of the key questions answered by the report are:
· What was the market size in 2017 and forecast from 2017 to 2022?
· What will be the industry market growth from 2017 to 2022?
· What are the major drivers, restraints, opportunities, challenges, and industry trends and their impact on the market forecast?
· What are the major segments leading the market growth and why?
- Which are the leading players in the market and what are the major strategies adopted by them to sustain the market competition?
Market Classification
- Hyaluronic Acid Market, By Product, Estimates and Forecast, 2012-2022 ($Million)
- Single injection
- Three injection
- Five injection
- Hyaluronic Acid Market, By Application, Estimates and Forecast, 2012-2022 ($Million)
- Dermal fillers
- Osteoarthritis
- Ophthalmic
- Vesicoureteral reflux
- Hyaluronic Acid Market, By Region, Estimates and Forecast, 2012-2022 ($Million)
- North America
- North America Hyaluronic Acid Market, By Country
- North America Hyaluronic Acid Market, By Product
- North America Hyaluronic Acid Market, By Application
- U.S. Hyaluronic Acid Market, By Product
- U.S. Hyaluronic Acid Market, By Application
- Canada Hyaluronic Acid Market, By Product
- Canada Hyaluronic Acid Market, By Application
- Mexico Hyaluronic Acid Market, By Product
- Mexico Hyaluronic Acid Market, By Application
-
- Europe
- Europe Hyaluronic Acid Market, By Country
- Europe Hyaluronic Acid Market, By Product
- Europe Hyaluronic Acid Market, By Application
- Germany Hyaluronic Acid Market, By Product
- Germany Hyaluronic Acid Market, By Application
- France Hyaluronic Acid Market, By Product
- France Hyaluronic Acid Market, By Application
- UK Hyaluronic Acid Market, By Product
- UK Hyaluronic Acid Market, By Application
- Italy Hyaluronic Acid Market, By Product
- Italy Hyaluronic Acid Market, By Application
- Spain Hyaluronic Acid Market, By Product
- Spain Hyaluronic Acid Market, By Application
- Rest of Europe Hyaluronic Acid Market, By Product
- Rest of Europe Hyaluronic Acid Market, By Application
-
- Asia-Pacific
- Asia-Pacific Hyaluronic Acid Market, By Country
- Asia-Pacific Hyaluronic Acid Market, By Product
- Asia-Pacific Hyaluronic Acid Market, By Application
- Japan Hyaluronic Acid Market, By Product
- Japan Hyaluronic Acid Market, By Application
- Australia Hyaluronic Acid Market, By Product
- Australia Hyaluronic Acid Market, By Application
- India Hyaluronic Acid Market, By Product
- India Hyaluronic Acid Market, By Application
- South Korea Hyaluronic Acid Market, By Product
- South Korea Hyaluronic Acid Market, By Application
- Rest of Asia-Pacific Hyaluronic Acid Market, By Product
- Rest of Asia-Pacific Hyaluronic Acid Market, By Application
-
- Rest of the World
- Rest of the World Hyaluronic Acid Market, By Country
- Rest of the World Hyaluronic Acid Market, By Product
- Rest of the World Hyaluronic Acid Market, By Application
- Brazil Hyaluronic Acid Market, By Product
- Brazil Hyaluronic Acid Market, By Application
- South Africa Hyaluronic Acid Market, By Product
- South Africa Hyaluronic Acid Market, By Application
- Saudi Arabia Hyaluronic Acid Market, By Product
- Saudi Arabia Hyaluronic Acid Market, By Application
- Turkey Hyaluronic Acid Market, By Product
- Turkey Hyaluronic Acid Market, By Application
- United Arab Emirates Hyaluronic Acid Market, By Product
- United Arab Emirates Hyaluronic Acid Market, By Application
- Others Hyaluronic Acid Market, By Product
- Others Hyaluronic Acid Market, By Application
Table of Contents
1. Introduction
1.1. Report Description
1.2. Research Methodology
2. Executive Summary
2.1. Key Highlights
3. Market Overview
3.1. Introduction
3.1.1. Market Definition
3.1.2. Market Segmentation
3.2. Market Dynamics
3.2.1. Drivers
3.2.1.1. Rising Geriatric Population Across The Globe
3.2.1.2. Increasing Application In Regenerative Medicine and Tissue Engineering
3.2.1.3. Growing Demand For Anti-aging Solutions and Minimally Invasive Aesthetic Treatments
3.2.2. Restraints
3.2.2.1. High Cost and Side Effects Associated With Hyaluronic Acid Cycles
3.2.3. Opportunities
3.2.3.1. Emerging Markets to Offer Lucrative Growth Opportunities
4. Hyaluronic Acid Market, By Product
4.1. Introduction
4.2. Hyaluronic Acid Market Assessment and Forecast, By Product, 2012-2022
4.3. Single Injection
4.3.1. Market Assessment and Forecast, By Region, 2012-2022 ($Million)
4.4. Three Injection
4.4.1. Market Assessment and Forecast, By Region, 2012-2022 ($Million)
4.5. Five Injection
4.5.1. Market Assessment and Forecast, By Region, 2012-2022 ($Million)
5. Hyaluronic Acid Market, By Application
5.1. Introduction
5.2. The Hyaluronic Acid Market Assessment and Forecast, By Application, 2012-2022
5.3. Dermal Fillers
5.3.1. Market Assessment and Forecast, By Region, 2012-2022 ($Million)
5.4. Osteoarthritis
5.4.1. Market Assessment and Forecast, By Region, 2012-2022 ($Million)
5.5. Ophthalmic
5.5.1. Market Assessment and Forecast, By Region, 2012-2022 ($Million)
5.6. Vesicoureteral Reflux
5.6.1. Market Assessment and Forecast, By Region, 2012-2022 ($Million)
6. Hyaluronic Acid Market, By Region
6.1. Introduction
6.2. Hyaluronic Acid Market Assessment and Forecast, By Product, 2012-2022 ($Million)
6.3. Hyaluronic Acid Market Assessment and Forecast, By Application , 2012-2022 ($Million)
6.4. North America
6.4.1. Market Assessment and Forecast, By Country, 2012-2022 ($Million)
6.4.2. Market Assessment and Forecast, By Product, 2012-2022 ($Million)
6.4.3. Market Assessment and Forecast, By Application, 2012-2022 ($Million)
6.4.4. U.S.
6.4.4.1. Market Assessment and Forecast, By Product, 2012-2022 ($Million)
6.4.4.2. Market Assessment and Forecast, By Application, 2012-2022 ($Million)
6.4.5. Canada
6.4.5.1. Market Assessment and Forecast, By Product, 2012-2022 ($Million)
6.4.5.2. Market Assessment and Forecast, By Application, 2012-2022 ($Million)
6.4.6. Mexico
6.4.6.1. Market Assessment and Forecast, By Product, 2012-2022 ($Million)
6.4.6.2. Market Assessment and Forecast, By Application, 2012-2022 ($Million)
6.5. Europe
6.5.1. Market Assessment and Forecast, By Country, 2012-2022 ($Million)
6.5.2. Market Assessment and Forecast, By Product, 2012-2022 ($Million)
6.5.3. Market Assessment and Forecast, By Application, 2012-2022 ($Million)
6.5.4. Germany
6.5.4.1. Market Assessment and Forecast, By Product, 2012-2022 ($Million)
6.5.4.2. Market Assessment and Forecast, By Application, 2012-2022 ($Million)
6.5.5. France
6.5.5.1. Market Assessment and Forecast, By Product, 2012-2022 ($Million)
6.5.5.2. Market Assessment and Forecast, By Application, 2012-2022 ($Million)
6.5.6. UK
6.5.6.1. Market Assessment and Forecast, By Product, 2012-2022 ($Million)
6.5.6.2. Market Assessment and Forecast, By Application, 2012-2022 ($Million)
6.5.7. Italy
6.5.7.1. Market Assessment and Forecast, By Product, 2012-2022 ($Million)
6.5.7.2. Market Assessment and Forecast, By Application, 2012-2022 ($Million)
6.5.8. Spain
6.5.8.1. Market Assessment and Forecast, By Product, 2012-2022 ($Million)
6.5.8.2. Market Assessment and Forecast, By Application, 2012-2022 ($Million)
6.5.9. Rest of Europe
6.5.9.1. Market Assessment and Forecast, By Product, 2012-2022 ($Million)
6.5.9.2. Market Assessment and Forecast, By Application, 2012-2022 ($Million)
6.6. Asia-Pacific
6.6.1. Market Assessment and Forecast, By Country, 2012-2022 ($Million)
6.6.2. Market Assessment and Forecast, By Product, 2012-2022 ($Million)
6.6.3. Market Assessment and Forecast, By Application, 2012-2022 ($Million)
6.6.4. Japan
6.6.4.1. Market Assessment and Forecast, By Product, 2012-2022 ($Million)
6.6.4.2. Market Assessment and Forecast, By Application, 2012-2022 ($Million)
6.6.5. China
6.6.5.1. Market Assessment and Forecast, By Product, 2012-2022 ($Million)
6.6.5.2. Market Assessment and Forecast, By Application, 2012-2022 ($Million)
6.6.6. Australia
6.6.6.1. Market Assessment and Forecast, By Product, 2012-2022 ($Million)
6.6.6.2. Market Assessment and Forecast, By Application, 2012-2022 ($Million)
6.6.7. India
6.6.7.1. Market Assessment and Forecast, By Product, 2012-2022 ($Million)
6.6.7.2. Market Assessment and Forecast, By Application, 2012-2022 ($Million)
6.6.8. South Korea
6.6.8.1. Market Assessment and Forecast, By Product, 2012-2022 ($Million)
6.6.8.2. Market Assessment and Forecast, By Application, 2012-2022 ($Million)
6.6.9. Rest of Asia-Pacific
6.6.9.1. Market Assessment and Forecast, By Product, 2012-2022 ($Million)
6.6.9.2. Market Assessment and Forecast, By Application, 2012-2022 ($Million)
6.7. Rest of the World
6.7.1. Market Assessment and Forecast, By Country, 2012-2022 ($Million)
6.7.2. Market Assessment and Forecast, By Product, 2012-2022 ($Million)
6.7.3. Market Assessment and Forecast, By Application, 2012-2022 ($Million)
6.7.4. Brazil
6.7.4.1. Market Assessment and Forecast, By Product, 2012-2022 ($Million)
6.7.4.2. Market Assessment and Forecast, By Application, 2012-2022 ($Million)
6.7.5. Turkey
6.7.5.1. Market Assessment and Forecast, By Product, 2012-2022 ($Million)
6.7.5.2. Market Assessment and Forecast, By Application, 2012-2022 ($Million)
6.7.6. Saudi Arabia
6.7.6.1. Market Assessment and Forecast, By Product, 2012-2022 ($Million)
6.7.6.2. Market Assessment and Forecast, By Application, 2012-2022 ($Million)
6.7.7. South Africa
6.7.7.1. Market Assessment and Forecast, By Product, 2012-2022 ($Million)
6.7.7.2. Market Assessment and Forecast, By Application, 2012-2022 ($Million)
6.7.8. United Arab Emirates
6.7.8.1. Market Assessment and Forecast, By Product, 2012-2022 ($Million)
6.7.8.2. Market Assessment and Forecast, By Application, 2012-2022 ($Million)
6.7.9. Others
6.7.9.1. Market Assessment and Forecast, By Product, 2012-2022 ($Million)
6.7.9.2. Market Assessment and Forecast, By Application, 2012-2022 ($Million)
7. Company Profiles
7.1. Allergan
7.1.1. Business Overview
7.1.2. Product Portfolio
7.1.3. Key financials
7.1.4. Strategic Developments
7.2. Sanofi
7.2.1. Business Overview
7.2.2. Product Portfolio
7.2.3. Key Financials
7.2.4. Strategic Developments
7.3. Genzyme Corporation
7.3.1. Business Overview
7.3.2. Product Portfolio
7.3.3. Key Financials
7.3.4. Strategic Developments
7.4. Anika Therapeutics, Inc.
7.4.1. Business Overview
7.4.2. Product Portfolio
7.4.3. Strategic Developments
7.5. Salix Pharmaceuticals, Inc.
7.5.1. Business Overview
7.5.2. Product Portfolio
7.5.3. Key Financials
7.5.4. Strategic Developments
7.6. Seikagaku Corporation
7.6.1. Business Overview
7.6.2. Product Portfolio
7.6.3. Strategic Developments
7.7. F. Hoffmann-La Roche AG
7.7.1. Business Overview
7.7.2. Product Portfolio
7.7.3. Key Financials
7.7.4. Strategic Developments
7.8. Galderma S.A.
7.8.1. Business Overview
7.8.2. Product Portfolio
7.8.3. Strategic Developments
7.9. Zimmer Biomet
7.9.1. Business Overview
7.9.2. Product Portfolio
7.9.3. Strategic Developments
7.10. Smith & Nephew PLC
7.10.1. Business Overview
7.10.2. Product Portfolio
7.10.3. Strategic Developments
7.11. Ferring B.V.
7.11.1. Business Overview
7.11.2. Product Portfolio
7.11.3. Strategic Developments
List of Tables
Table 1.Global Hyaluronic Acid Market, By Product, 2012-2022 ($Million)
Table 2.Single injection Market, By Region, 2012-2022 ($Million)
Table 3.Three Injection Market, By Region, 2012-2022 ($Million)
Table 4.Five injection Market, By Region, 2012-2022 ($Million)
Table 5.Global Hyaluronic Acid Market, By Application, 2012-2022 ($Million)
Table 6.Dermal fillers Market, By Region, 2012-2022 ($Million)
Table 7.Osteoarthritis Market, By Region, 2012-2022 ($Million)
Table 8.Ophthalmic Market, By Region, 2012-2022 ($Million)
Table 9.Vesicoureteral reflux Market, By Region, 2012-2022 ($Million)
Table 10.North America Hyaluronic Acid Market, By Country, 2012-2022 ($Million)
Table 11.North America Hyaluronic Acid Market, By Product, 2012-2022 ($Million)
Table 12.North America Hyaluronic Acid Market, By Application, 2012-2022 ($Million)
Table 13.U.S. Hyaluronic Acid Market, By Product, 2012-2022 ($Million)
Table 14.U.S. Hyaluronic Acid Market, By Application, 2012-2022 ($Million)
Table 15.Canada Hyaluronic Acid Market, By Product, 2012-2022 ($Million)
Table 16.Canada Hyaluronic Acid Market, By Application, 2012-2022 ($Million)
Table 17.Mexico Hyaluronic Acid Market, By Product, 2012-2022 ($Million)
Table 18.Mexico Hyaluronic Acid Market, By Application, 2012-2022 ($Million)
Table 19.Europe Hyaluronic Acid Market, By Country, 2012-2022 ($Million)
Table 20.Europe Hyaluronic Acid Market, By Product, 2012-2022 ($Million)
Table 21.Europe Hyaluronic Acid Market, By Application, 2012-2022 ($Million)
Table 22.Germany Hyaluronic Acid Market, By Product, 2012-2022 ($Million)
Table 23.Germany Hyaluronic Acid Market, By Application, 2012-2022 ($Million)
Table 24.France Hyaluronic Acid Market, By Product, 2012-2022 ($Million)
Table 25.France Hyaluronic Acid Market, By Application, 2012-2022 ($Million)
Table 26.UK Hyaluronic Acid Market, By Product, 2012-2022 ($Million)
Table 27.UK Hyaluronic Acid Market, By Application, 2012-2022 ($Million)
Table 28.Italy Hyaluronic Acid Market, By Product, 2012-2022 ($Million)
Table 29.Italy Hyaluronic Acid Market, By Application, 2012-2022 ($Million)
Table 30.Spain Hyaluronic Acid Market, By Product, 2012-2022 ($Million)
Table 31.Spain Hyaluronic Acid Market, By Application, 2012-2022 ($Million)
Table 32.Rest of Europe Hyaluronic Acid Market, By Product, 2012-2022 ($Million)
Table 33.Rest of Europe Hyaluronic Acid Market, By Application, 2012-2022 ($Million)
Table 34.Asia-Pacific Hyaluronic Acid Market, By Country, 2012-2022 ($Million)
Table 35.Asia-Pacific Hyaluronic Acid Market, By Product, 2012-2022 ($Million)
Table 36.Asia-Pacific Hyaluronic Acid Market, By Application, 2012-2022 ($Million)
Table 37.Japan Hyaluronic Acid Market, By Product, 2012-2022 ($Million)
Table 38.Japan Hyaluronic Acid Market, By Application, 2012-2022 ($Million)
Table 39.China Hyaluronic Acid Market, By Product, 2012-2022 ($Million)
Table 40.China Hyaluronic Acid Market, By Application, 2012-2022 ($Million)
Table 41.Australia Hyaluronic Acid Market, By Product, 2012-2022 ($Million)
Table 42.Australia Hyaluronic Acid Market, By Application, 2012-2022 ($Million)
Table 43.India Hyaluronic Acid Market, By Product, 2012-2022 ($Million)
Table 44.India Hyaluronic Acid Market, By Application, 2012-2022 ($Million)
Table 45.South Korea Hyaluronic Acid Market, By Product, 2012-2022 ($Million)
Table 46.South Korea Hyaluronic Acid Market, By Application, 2012-2022 ($Million)
Table 47.Rest of Asia-Pacific Hyaluronic Acid Market, By Product, 2012-2022 ($Million)
Table 48.Rest of Asia-Pacific Hyaluronic Acid Market, By Application, 2012-2022 ($Million)
Table 49.Rest of the World Hyaluronic Acid Market, By Country, 2012-2022 ($Million)
Table 50.Rest of the World Hyaluronic Acid Market, By Product, 2012-2022 ($Million)
Table 51.Rest of the World Hyaluronic Acid Market, By Application, 2012-2022 ($Million)
Table 52.Brazil Hyaluronic Acid Market, By Product, 2012-2022 ($Million)
Table 53.Brazil Hyaluronic Acid Market, By Application, 2012-2022 ($Million)
Table 54.Turkey Hyaluronic Acid Market, By Product, 2012-2022 ($Million)
Table 55.Turkey Hyaluronic Acid Market, By Application, 2012-2022 ($Million)
Table 56.Saudi Arabia Hyaluronic Acid Market, By Product, 2012-2022 ($Million)
Table 57.Saudi Arabia Hyaluronic Acid Market, By Application, 2012-2022 ($Million)
Table 58.South Africa Hyaluronic Acid Market, By Product, 2012-2022 ($Million)
Table 59.South Africa Hyaluronic Acid Market, By Application, 2012-2022 ($Million)
Table 60.United Arab Emirates Hyaluronic Acid Market, By Product, 2012-2022 ($Million)
Table 61.United Arab Emirates Hyaluronic Acid Market, By Application, 2012-2022 ($Million)
Table 62.Others Hyaluronic Acid Market, By Product, 2012-2022 ($Million)
Table 63.Others Hyaluronic Acid Market, By Application, 2012-2022 ($Million)
Table 64.Allergan: Key Strategic Developments, 2017-2017
Table 65.Sanofi: Key Strategic Developments, 2017-2017
Table 66.Genzyme Corporation: Key Strategic Developments, 2017-2017
Table 67.Anika Therapeutics, Inc.: Key Strategic Developments, 2017-2017
Table 68.Salix Pharmaceuticals, Inc.: Key Strategic Developments, 2017-2017
Table 69.Seikagaku Corporation: Key Strategic Developments, 2017-2017
Table 70.F. Hoffmann-La Roche AG: Key Strategic Developments, 2017-2017
Table 71.Galderma S.A.: Key Strategic Developments, 2017-2017
Table 72.Zimmer Biomet: Key Strategic Developments, 2017-2017
Table 73.Smith & Nephew PLC: Key Strategic Developments, 2017-2017
Table 74.Ferring B.V.: Key Strategic Developments, 2017-2017
List of Figures
Figure 1.Global Hyaluronic Acid Market Share, By Product, 2017 & 2025
Figure 2.Global Hyaluronic Acid Market, By Application, 2017, ($Million)
Figure 3.Global Hyaluronic Acid Market, By Region, 2017, ($Million)
Figure 4.Allergan: Net Revenues, 2017-2017 ($Million)
Figure 5.Allergan: Net Revenue Share, By Segment, 2017
Figure 6.Allergan: Net Revenue Share, By Geography, 2017
Figure 7.Sanofi: Net Revenues, 2017-2017 ($Million)
Figure 8.Sanofi: Net Revenue Share, By Segment, 2017
Figure 9.Sanofi: Net Revenue Share, By Geography, 2017
Figure 10.Genzyme Corporation: Net Revenues, 2017-2017 ($Million)
Figure 11.Genzyme Corporation: Net Revenue Share, By Segment, 2017
Figure 12.Genzyme Corporation: Net Revenue Share, By Geography, 2017
Figure 13.Salix Pharmaceuticals, Inc.: Net Revenues, 2017-2017 ($Million)
Figure 14.Salix Pharmaceuticals, Inc.: Net Revenue Share, By Segment, 2017
Figure 15.Salix Pharmaceuticals, Inc.: Net Revenue Share, By Geography, 2017
Figure 16.F. Hoffmann-La Roche AG: Net Revenues, 2017-2017 ($Million)
Figure 17.F. Hoffmann-La Roche AG: Net Revenue Share, By Segment, 2017
Figure 18.F. Hoffmann-La Roche AG: Net Revenue Share, By Geography, 2017
Research Methodology
We use both primary as well as secondary research for our market surveys, estimates and for developing forecast. Our research process commence by analyzing the problem which enable us to design the scope for our research study. Our research process is uniquely designed with enough flexibility to adjust according to changing nature of products and markets, while retaining core element to ensure reliability and accuracy in research findings. We understand both macro and micro-economic factors to evaluate and forecast different market segments.
Data Mining
Data is extensively collected through various secondary sources such as annual reports, investor presentations, SEC filings, and other corporate publications. We also refer trade magazines, technical journals, paid databases such as Factiva and Bloomberg, industry trade journals, scientific journals, and social media data to understand market dynamics and industry trends. Further, we also conduct primary research to understand market drivers, restraints, opportunities, challenges, and competitive scenario to build our analysis.
Data Collection Matrix
|
Data Collection Matrix |
Supply Side |
Demand Side |
|
Primary Data Sources |
|
|
|
Secondary Data Sources |
|
|
Market Modeling and Forecasting
We use epidemiology and capital equipment-based models to forecast market size of different segments at country and regional level.
- Epidemiology-based Forecasting Model: This method uses epidemiology data gathered through various publications and from physicians to estimate population of patients, flow of treatment of individual disease and therapies. The data collected through this method includes statics on incidence of disease, population suffering from disease, and treatment population. This method is used to understand:
- Number of patients for particular device or medical procedure and
- Repeated use of particular device depending on health and condition of patient
- Capital-based Forecasting Model: This method of forecasting is based on number of replacements, installed-based and new sales of capital equipment used in various healthcare and diagnostic centers. These three parameters are calculated and forecast is developed. Installation base is calculated as average number of units per facility; while sales for particular year is calculated from number of new and replace units. Secondary data is collected through various supply chain intermediaries and opinion leaders to arrive at installation and sales rate. These techniques help our analysts in validating market and developed market estimates and forecast.
We do forecast on basis of several parameters such as market drivers, market opportunities, industry trends government regulations, raw materials supply and trade dynamics to ensure relevance of forecast with market scenario. With increasing need to granulized information, we used bottom-up methodology for forecasting where we evaluate each regional segment differently and combined all forecast to develop final market forecast.
Data Validation
We believe primary research is a very important tool in analyzing and forecasting different markets. In order to make sure accuracy of our findings, our team conducts primary interviews at every stage of research to gain deep insights into current business environment and future trends and key developments in market. This includes use of various methods such as telephonic interviews, focus groups, face to face interviews and questionnaires to validate our research from all aspects. We validate our data through primary research from key industry leaders such as CEO, product managers, marketing managers, suppliers, distributors, and consumers are frequently interviewed. These interviews provide valuable insights which help us to have better market understanding besides validating our estimates and forecast.
Data Triangulation

Industry Analysis
|
Qualitative Data |
Quantitative Data (2017-2025) |
|
|