Heat Transfer Fluids Market by Product and Application - Global Industry Analysis and Forecast to 2022
Published On : November 2017 Pages : 200 Category: Petrochemicals Report Code : CM11318
Industry Trend Analysis
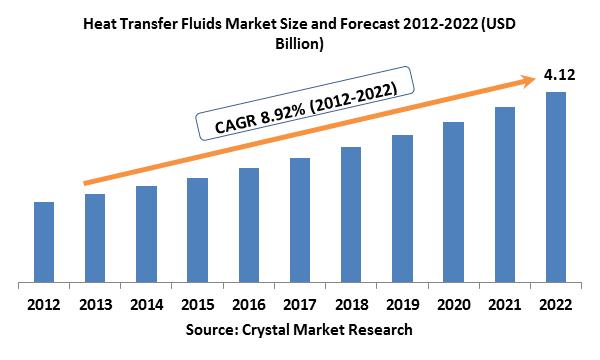
The global heat transfer fluids market was evaluated around USD 1.75 billion in the 2017 and is expected to reach approximately USD 4.12 billion by the end of 2022 while registering itself at a compound annual growth rate (CAGR) of 8.92% over the forecast period. Speedy industrialization in BRICS countries, especially in production sectors involving metal processing, automotive, oil & gas, and chemical, is anticipated to be a key factor fueling the demand. Growth driving factors for production segment in these areas include technological know-how, availability of large pool of skilled labor and encouraging overseas investment norms. Extensive development in oil and gas production is expected to influence the market growth during the forecast period positively. Concentrated solar power (CSP) is a promising technology to recuperate solar energy. This needs a mean to transmit the generated heat from the collectors to the generators and sequentially constantly chill the PV surface. Rising CSP plants installation in countries including the United States, China, and France is anticipated to boost the demand for product in this section during the projected future. These substances are also necessary for chemical and pharmaceutical plants to preserve the temperature of equipment and furnace in group processes. They are also utilized as heat recovery fluids and coolant in thermal reactors throughout these industries. Rising chemical and pharmaceutical production industries in BRIC countries are expected to fuel product demand in these sections. Strict environmental regulations along with the uneven raw material (including base oil, crude oils) supply-demand scenario are anticipated to hamper market growth over the projected period.
Product Outlook and Trend Analysis
In 2017, silicone and aromatics created the major product section, reporting for around 40% of industry share and are anticipated to grow at a compound annual growth rate of 6.3% over the forecast period. Silicone and aromatic fluids are particularly planned to function at enormously elevated temperatures. These are extensively utilized in wood processes, food processing, chemical, plastics, and spin & weave industries. Rising chemical and oil & gas industries in Asia Pacific region combined with growing demand for artificial thermal oils in the applications is anticipated to fuel the demand for product during the forecast years. Glycol fluids are expected to be the highest growing product section owing to brilliant antifreeze characteristics. They are normally utilized as antifreeze agents in beverage and food industry. Increasing beverage and food industry predominantly in Asia Pacific region is expected to drive the demand during the forecast years.
Application Outlook and Trend Analysis
In 2017, oil & gas was the leading application section reporting for 23.8% of overall market volume and are anticipated to expand at a compound annual growth rate of 5.5% during forecast period. Increasing use of heating oil in offshore gas & oil thermal processes is expected to fuel the growth during the projected period. An escalating number of LNG terminals are likely to drive the growth of the market. Asia Pacific and European petroleum market are projected to experience rapid expansion during the forecast years. This is expected to elevate product demand in the abovementioned areas. Concentrated solar power (CSP) is expected to be the highest growing application section during the projected period. Heat transfer fluids are vital components for transferring and storing thermal power in CSP. Rising CSP installations, especially in Asia Pacific and Europe, is anticipated to fuel the growth in this section during the projected period. Heating, ventilating & air conditioning (HVAC) and food & beverage are expected to witness moderate growth during the forecast years. In 2017, China and India were the major customers in HVAC industry.
Regional Outlook and Trend Analysis
In 2017, European heat transfer fluids market ruled the global market, with an overall demand more than 140.0-kilotons. It is anticipated to lose market share to elevated growth industries including South & Central America and Asia Pacific during the forecast years. Augmented population along with elevated energy demand has stimulated the energy and power sector. Fresh developments seen in new solar plants together with rising energy needs are anticipated to fuel the heat transfer fluids market in the European region. Rising need for utilizing surplus energy and heat dissolute in key industries like HVAC, concentrated solar power (CSP), chemical plants are anticipated to fuel market penetration in this region during the forecast years. Asia Pacific regional heat transfer fluids industry is predicted to experience the high benefits during the forecast years and reports for around 24% of the overall market share by 2022. Growing renewal energy segment and brisk expansion in thermal management are anticipated to fuel the heat transfer fluids market in Japan and China. North America region is expected to witness a sluggish growth due to steady demands in key end-user industries, reporting for around 28% of overall market revenue by 2022.
Competitive Outlook and Trend Analysis
Global heat transfer fluids market is extremely fused with leading five participants including Exxon Mobil Corporation, Royal Dutch Shell plc, The Dow Chemical Company, BP P.L.C. and Eastman chemical Company, reporting for around 75% in 2017. In 2017, the Dow Chemical Company was the market leader with a market share of around 28% of the global market revenue. The company presents thermal fluids for an extensive host of industries involving pharmaceutical, energy & water, industrial, and chemical. Key products presented in the heat transfer section involve inhibited glycol fluids and artificial fluids. Market players are investing a lot in research and development to expand bio-based thermic oils due to strict environmental regulations concerning the synthetic equivalents. Market players have also been funding to commercialize nanofluids with improved thermal characteristics and multi-utility in a variety of applications.
The global heat transfer fluids market is segmented as follows –
By Product
- Silicones & Aromatics
- Mineral Oils
- Glycol-Based Fluids
- Others
By Application
- Oil & gas
- Chemical industry
- CSP
- Food & beverages
- Plastics
- Pharmaceuticals
- HVAC
- Others
By Region
- North America
- U.S
- Canada
- Mexico
- Europe
- Germany
- France
- UK
- Italy
- Spain
- Rest of Europe
- Asia-Pacific
- Japan
- China
- Australia
- India
- South Korea
- Rest of Asia Pacific
- Rest of the World
- Brazil
- South Africa
- Saudi Arabia
- United Arab Emirates
- Others
Some of the key questions answered by the report are:
· What was the market size in 2017 and forecast from 2017 to 2022?
· What will be the industry market growth from 2017 to 2022?
· What are the major drivers, restraints, opportunities, challenges, and industry trends and their impact on the market forecast?
· What are the major segments leading the market growth and why?
· Which are the leading players in the market and what are the major strategies adopted by them to sustain the market competition?
- Heat Transfer Fluids Market, By Product, Estimates and Forecast, 2012-2022 ($Million)
- Silicones and Aromatics
- Mineral Oils
- Glycol-Based Fluids
- Others
- Heat Transfer Fluids Market, By Application, Estimates and Forecast, 2012-2022 ($Million)
- Oil and Gas
- Chemical Industry
- CSP
- Food and Beverages
- Plastics
- Pharmaceuticals
- HVAC
- Others
- Heat Transfer Fluids Market, By Region, Estimates and Forecast, 2012-2022 ($Million)
- North America
- North America Heat Transfer Fluids Market, By Country
- North America Heat Transfer Fluids Market, By Product
- North America Heat Transfer Fluids Market, By Application
- U.S. Heat Transfer Fluids Market, By Product
- U.S. Heat Transfer Fluids Market, By Application
- Canada Heat Transfer Fluids Market, By Product
- Canada Heat Transfer Fluids Market, By Application
- Mexico Heat Transfer Fluids Market, By Product
- Mexico Heat Transfer Fluids Market, By Application
-
- Europe
- Europe Heat Transfer Fluids Market, By Country
- Europe Heat Transfer Fluids Market, By Product
- Europe Heat Transfer Fluids Market, By Application
- Germany Heat Transfer Fluids Market, By Product
- Germany Heat Transfer Fluids Market, By Application
- France Heat Transfer Fluids Market, By Product
- France Heat Transfer Fluids Market, By Application
- UK Heat Transfer Fluids Market, By Product
- UK Heat Transfer Fluids Market, By Application
- Italy Heat Transfer Fluids Market, By Product
- Italy Heat Transfer Fluids Market, By Application
- Spain Heat Transfer Fluids Market, By Product
- Spain Heat Transfer Fluids Market, By Application
- Rest of Europe Heat Transfer Fluids Market, By Product
- Rest of Europe Heat Transfer Fluids Market, By Application
-
- Asia-Pacific
- Asia-Pacific Heat Transfer Fluids Market, By Country
- Asia-Pacific Heat Transfer Fluids Market, By Product
- Asia-Pacific Heat Transfer Fluids Market, By Application
- Japan Heat Transfer Fluids Market, By Product
- Japan Heat Transfer Fluids Market, By Application
- Australia Heat Transfer Fluids Market, By Product
- Australia Heat Transfer Fluids Market, By Application
- India Heat Transfer Fluids Market, By Product
- India Heat Transfer Fluids Market, By Application
- South Korea Heat Transfer Fluids Market, By Product
- South Korea Heat Transfer Fluids Market, By Application
- Rest of Asia-Pacific Heat Transfer Fluids Market, By Product
- Rest of Asia-Pacific Heat Transfer Fluids Market, By Application
-
- Rest of the World
- Rest of the World Heat Transfer Fluids Market, By Country
- Rest of the World Heat Transfer Fluids Market, By Product
- Rest of the World Heat Transfer Fluids Market, By Application
- Brazil Heat Transfer Fluids Market, By Product
- Brazil Heat Transfer Fluids Market, By Application
- South Africa Heat Transfer Fluids Market, By Product
- South Africa Heat Transfer Fluids Market, By Application
- Saudi Arabia Heat Transfer Fluids Market, By Product
- Saudi Arabia Heat Transfer Fluids Market, By Application
- Turkey Heat Transfer Fluids Market, By Product
- Turkey Heat Transfer Fluids Market, By Application
- United Arab Emirates Heat Transfer Fluids Market, By Product
- United Arab Emirates Heat Transfer Fluids Market, By Application
- Others Heat Transfer Fluids Market, By Product
- Others Heat Transfer Fluids Market, By Application
1. Introduction
1.1. Report Description
1.2. Research Methodology
2. Executive Summary
2.1. Key Highlights
3. Market Overview
3.1. Introduction
3.1.1. Market Definition
3.1.2. Market Segmentation
3.2. Market Dynamics
3.2.1. Drivers
3.2.1.1. Increasing Concentrating Solar Power (CSP) Industry
3.2.1.2. FDA Approval For Food Grade Heat Transfer Fluids
3.2.1.3. Growing Importance Of Thermal Fluid Systems Over Steam Systems
3.2.2. Restraints
3.2.2.1. Stringent Environment Regulation
3.2.3. Opportunities
3.2.3.1. Emerging Markets to Offer Lucrative Growth Opportunities
4. Heat Transfer Fluids Market, By Product
4.1. Introduction
4.2. Heat Transfer Fluids Market Assessment and Forecast, By Product, 2012-2022
4.3. Silicones & Aromatics
4.3.1. Market Assessment and Forecast, By Region, 2012-2022 ($Million)
4.4. Mineral Oils
4.4.1. Market Assessment and Forecast, By Region, 2012-2022 ($Million)
4.5. Glycol-Based Fluids
4.5.1. Market Assessment and Forecast, By Region, 2012-2022 ($Million)
4.6. Other Products
4.6.1. Market Assessment and Forecast, By Region, 2012-2022 ($Million)
5. Heat Transfer Fluids Market, By Application
5.1. Introduction
5.2. The Heat Transfer Fluids Market Assessment and Forecast, By Application, 2012-2022
5.3. Oil & gas
5.3.1. Market Assessment and Forecast, By Region, 2012-2022 ($Million)
5.4. Chemical industry
5.4.1. Market Assessment and Forecast, By Region, 2012-2022 ($Million)
5.5. CSP
5.5.1. Market Assessment and Forecast, By Region, 2012-2022 ($Million)
5.6. Food & beverages
5.6.1. Market Assessment and Forecast, By Region, 2012-2022 ($Million)
5.7. Plastics
5.7.1. Market Assessment and Forecast, By Region, 2012-2022 ($Million)
5.8. Pharmaceuticals
5.8.1. Market Assessment and Forecast, By Region, 2012-2022 ($Million)
5.9. HVAC
5.9.1. Market Assessment and Forecast, By Region, 2012-2022 ($Million)
5.10. Other Applications
5.10.1. Market Assessment and Forecast, By Region, 2012-2022 ($Million)
6. Heat Transfer Fluids Market, By Region
6.1. Introduction
6.2. Heat Transfer Fluids Market Assessment and Forecast, By Product, 2012-2022 ($Million)
6.3. Heat Transfer Fluids Market Assessment and Forecast, By Application , 2012-2022 ($Million)
6.4. North America
6.4.1. Market Assessment and Forecast, By Country, 2012-2022 ($Million)
6.4.2. Market Assessment and Forecast, By Product, 2012-2022 ($Million)
6.4.3. Market Assessment and Forecast, By Application, 2012-2022 ($Million)
6.4.4. U.S.
6.4.4.1. Market Assessment and Forecast, By Product, 2012-2022 ($Million)
6.4.4.2. Market Assessment and Forecast, By Application, 2012-2022 ($Million)
6.4.5. Canada
6.4.5.1. Market Assessment and Forecast, By Product, 2012-2022 ($Million)
6.4.5.2. Market Assessment and Forecast, By Application, 2012-2022 ($Million)
6.4.6. Mexico
6.4.6.1. Market Assessment and Forecast, By Product, 2012-2022 ($Million)
6.4.6.2. Market Assessment and Forecast, By Application, 2012-2022 ($Million)
6.5. Europe
6.5.1. Market Assessment and Forecast, By Country, 2012-2022 ($Million)
6.5.2. Market Assessment and Forecast, By Product, 2012-2022 ($Million)
6.5.3. Market Assessment and Forecast, By Application, 2012-2022 ($Million)
6.5.4. Germany
6.5.4.1. Market Assessment and Forecast, By Product, 2012-2022 ($Million)
6.5.4.2. Market Assessment and Forecast, By Application, 2012-2022 ($Million)
6.5.5. France
6.5.5.1. Market Assessment and Forecast, By Product, 2012-2022 ($Million)
6.5.5.2. Market Assessment and Forecast, By Application, 2012-2022 ($Million)
6.5.6. UK
6.5.6.1. Market Assessment and Forecast, By Product, 2012-2022 ($Million)
6.5.6.2. Market Assessment and Forecast, By Application, 2012-2022 ($Million)
6.5.7. Italy
6.5.7.1. Market Assessment and Forecast, By Product, 2012-2022 ($Million)
6.5.7.2. Market Assessment and Forecast, By Application, 2012-2022 ($Million)
6.5.8. Spain
6.5.8.1. Market Assessment and Forecast, By Product, 2012-2022 ($Million)
6.5.8.2. Market Assessment and Forecast, By Application, 2012-2022 ($Million)
6.5.9. Rest of Europe
6.5.9.1. Market Assessment and Forecast, By Product, 2012-2022 ($Million)
6.5.9.2. Market Assessment and Forecast, By Application, 2012-2022 ($Million)
6.6. Asia-Pacific
6.6.1. Market Assessment and Forecast, By Country, 2012-2022 ($Million)
6.6.2. Market Assessment and Forecast, By Product, 2012-2022 ($Million)
6.6.3. Market Assessment and Forecast, By Application, 2012-2022 ($Million)
6.6.4. Japan
6.6.4.1. Market Assessment and Forecast, By Product, 2012-2022 ($Million)
6.6.4.2. Market Assessment and Forecast, By Application, 2012-2022 ($Million)
6.6.5. China
6.6.5.1. Market Assessment and Forecast, By Product, 2012-2022 ($Million)
6.6.5.2. Market Assessment and Forecast, By Application, 2012-2022 ($Million)
6.6.6. Australia
6.6.6.1. Market Assessment and Forecast, By Product, 2012-2022 ($Million)
6.6.6.2. Market Assessment and Forecast, By Application, 2012-2022 ($Million)
6.6.7. India
6.6.7.1. Market Assessment and Forecast, By Product, 2012-2022 ($Million)
6.6.7.2. Market Assessment and Forecast, By Application, 2012-2022 ($Million)
6.6.8. South Korea
6.6.8.1. Market Assessment and Forecast, By Product, 2012-2022 ($Million)
6.6.8.2. Market Assessment and Forecast, By Application, 2012-2022 ($Million)
6.6.9. Rest of Asia-Pacific
6.6.9.1. Market Assessment and Forecast, By Product, 2012-2022 ($Million)
6.6.9.2. Market Assessment and Forecast, By Application, 2012-2022 ($Million)
6.7. Rest of the World
6.7.1. Market Assessment and Forecast, By Country, 2012-2022 ($Million)
6.7.2. Market Assessment and Forecast, By Product, 2012-2022 ($Million)
6.7.3. Market Assessment and Forecast, By Application, 2012-2022 ($Million)
6.7.4. Brazil
6.7.4.1. Market Assessment and Forecast, By Product, 2012-2022 ($Million)
6.7.4.2. Market Assessment and Forecast, By Application, 2012-2022 ($Million)
6.7.5. Turkey
6.7.5.1. Market Assessment and Forecast, By Product, 2012-2022 ($Million)
6.7.5.2. Market Assessment and Forecast, By Application, 2012-2022 ($Million)
6.7.6. Saudi Arabia
6.7.6.1. Market Assessment and Forecast, By Product, 2012-2022 ($Million)
6.7.6.2. Market Assessment and Forecast, By Application, 2012-2022 ($Million)
6.7.7. South Africa
6.7.7.1. Market Assessment and Forecast, By Product, 2012-2022 ($Million)
6.7.7.2. Market Assessment and Forecast, By Application, 2012-2022 ($Million)
6.7.8. United Arab Emirates
6.7.8.1. Market Assessment and Forecast, By Product, 2012-2022 ($Million)
6.7.8.2. Market Assessment and Forecast, By Application, 2012-2022 ($Million)
6.7.9. Others
6.7.9.1. Market Assessment and Forecast, By Product, 2012-2022 ($Million)
6.7.9.2. Market Assessment and Forecast, By Application, 2012-2022 ($Million)
7. Company Profiles
7.1. The Dow Chemical Company
7.1.1. Business Overview
7.1.2. Product Portfolio
7.1.3. Strategic Developments
7.2. Exxon Mobil Corporation
7.2.1. Business Overview
7.2.2. Product Portfolio
7.2.3. Key Financials
7.2.4. Strategic Developments
7.3. BASF SE
7.3.1. Business Overview
7.3.2. Product Portfolio
7.3.3. Key Financials
7.3.4. Strategic Developments
7.4. Chevron Corporation
7.4.1. Business Overview
7.4.2. Product Portfolio
7.4.3. Key Financials
7.4.4. Strategic Developments
7.5. Honeywell International Inc.
7.5.1. Business Overview
7.5.2. Product Portfolio
7.5.3. Key Financials
7.5.4. Strategic Developments
7.6. Conoco Phillips
7.6.1. Business Overview
7.6.2. Product Portfolio
7.6.3. Strategic Developments
7.7. Eastman Chemical Company
7.7.1. Business Overview
7.7.2. Product Portfolio
7.7.3. Strategic Developments
7.8. Royal Dutch Shell plc
7.8.1. Business Overview
7.8.2. Product Portfolio
7.8.3. Strategic Developments
7.9. Dynalene Inc.
7.9.1. Business Overview
7.9.2. Product Portfolio
7.9.3. Strategic Developments
7.10. Indian Oil Corporation Ltd. (IOCL)
7.10.1. Business Overview
7.10.2. Product Portfolio
7.10.3. Key Financials
7.10.4. Strategic Developments
7.11. Kost USA, Inc.
7.11.1. Business Overview
7.11.2. Product Portfolio
Strategic Developments
List of Tables
Table 1.Global Heat Transfer Fluids Market, By Product, 2012-2022 ($Million)
Table 2.Silicones & Aromatics Market, By Region, 2012-2022 ($Million)
Table 3.Mineral Oils Market, By Region, 2012-2022 ($Million)
Table 4.Glycol-Based Fluids Market, By Region, 2012-2022 ($Million)
Table 5.Other Products Market, By Region, 2012-2022 ($Million)
Table 6.Global Heat Transfer Fluids Market, By Application, 2012-2022 ($Million)
Table 7.Oil & Gas Market, By Region, 2012-2022 ($Million)
Table 8.Chemical Industry Market, By Region, 2012-2022 ($Million)
Table 9.CSP Market, By Region, 2012-2022 ($Million)
Table 10.Food & beverages Market, By Region, 2012-2022 ($Million)
Table 11.Plastics Market, By Region, 2012-2022 ($Million)
Table 12.Pharmaceuticals Market, By Region, 2012-2022 ($Million)
Table 13.HVAC Market, By Region, 2012-2022 ($Million)
Table 14.Other Applications Market, By Region, 2012-2022 ($Million)
Table 15.North America Heat Transfer Fluids Market, By Country, 2012-2022 ($Million)
Table 16.North America Heat Transfer Fluids Market, By Product, 2012-2022 ($Million)
Table 17.North America Heat Transfer Fluids Market, By Application, 2012-2022 ($Million)
Table 18.U.S. Heat Transfer Fluids Market, By Product, 2012-2022 ($Million)
Table 19.U.S. Heat Transfer Fluids Market, By Application, 2012-2022 ($Million)
Table 20.Canada Heat Transfer Fluids Market, By Product, 2012-2022 ($Million)
Table 21.Canada Heat Transfer Fluids Market, By Application, 2012-2022 ($Million)
Table 22.Mexico Heat Transfer Fluids Market, By Product, 2012-2022 ($Million)
Table 23.Mexico Heat Transfer Fluids Market, By Application, 2012-2022 ($Million)
Table 24.Europe Heat Transfer Fluids Market, By Country, 2012-2022 ($Million)
Table 25.Europe Heat Transfer Fluids Market, By Product, 2012-2022 ($Million)
Table 26.Europe Heat Transfer Fluids Market, By Application, 2012-2022 ($Million)
Table 27.Germany Heat Transfer Fluids Market, By Product, 2012-2022 ($Million)
Table 28.Germany Heat Transfer Fluids Market, By Application, 2012-2022 ($Million)
Table 29.France Heat Transfer Fluids Market, By Product, 2012-2022 ($Million)
Table 30.France Heat Transfer Fluids Market, By Application, 2012-2022 ($Million)
Table 31.UK Heat Transfer Fluids Market, By Product, 2012-2022 ($Million)
Table 32.UK Heat Transfer Fluids Market, By Application, 2012-2022 ($Million)
Table 33.Italy Heat Transfer Fluids Market, By Product, 2012-2022 ($Million)
Table 34.Italy Heat Transfer Fluids Market, By Application, 2012-2022 ($Million)
Table 35.Spain Heat Transfer Fluids Market, By Product, 2012-2022 ($Million)
Table 36.Spain Heat Transfer Fluids Market, By Application, 2012-2022 ($Million)
Table 37.Rest of Europe Heat Transfer Fluids Market, By Product, 2012-2022 ($Million)
Table 38.Rest of Europe Heat Transfer Fluids Market, By Application, 2012-2022 ($Million)
Table 39.Asia-Pacific Heat Transfer Fluids Market, By Country, 2012-2022 ($Million)
Table 40.Asia-Pacific Heat Transfer Fluids Market, By Product, 2012-2022 ($Million)
Table 41.Asia-Pacific Heat Transfer Fluids Market, By Application, 2012-2022 ($Million)
Table 42.Japan Heat Transfer Fluids Market, By Product, 2012-2022 ($Million)
Table 43.Japan Heat Transfer Fluids Market, By Application, 2012-2022 ($Million)
Table 44.China Heat Transfer Fluids Market, By Product, 2012-2022 ($Million)
Table 45.China Heat Transfer Fluids Market, By Application, 2012-2022 ($Million)
Table 46.Australia Heat Transfer Fluids Market, By Product, 2012-2022 ($Million)
Table 47.Australia Heat Transfer Fluids Market, By Application, 2012-2022 ($Million)
Table 48.India Heat Transfer Fluids Market, By Product, 2012-2022 ($Million)
Table 49.India Heat Transfer Fluids Market, By Application, 2012-2022 ($Million)
Table 50.South Korea Heat Transfer Fluids Market, By Product, 2012-2022 ($Million)
Table 51.South Korea Heat Transfer Fluids Market, By Application, 2012-2022 ($Million)
Table 52.Rest of Asia-Pacific Heat Transfer Fluids Market, By Product, 2012-2022 ($Million)
Table 53.Rest of Asia-Pacific Heat Transfer Fluids Market, By Application, 2012-2022 ($Million)
Table 54.Rest of the World Heat Transfer Fluids Market, By Country, 2012-2022 ($Million)
Table 55.Rest of the World Heat Transfer Fluids Market, By Product, 2012-2022 ($Million)
Table 56.Rest of the World Heat Transfer Fluids Market, By Application, 2012-2022 ($Million)
Table 57.Brazil Heat Transfer Fluids Market, By Product, 2012-2022 ($Million)
Table 58.Brazil Heat Transfer Fluids Market, By Application, 2012-2022 ($Million)
Table 59.Turkey Heat Transfer Fluids Market, By Product, 2012-2022 ($Million)
Table 60.Turkey Heat Transfer Fluids Market, By Application, 2012-2022 ($Million)
Table 61.Saudi Arabia Heat Transfer Fluids Market, By Product, 2012-2022 ($Million)
Table 62.Saudi Arabia Heat Transfer Fluids Market, By Application, 2012-2022 ($Million)
Table 63.South Africa Heat Transfer Fluids Market, By Product, 2012-2022 ($Million)
Table 64.South Africa Heat Transfer Fluids Market, By Application, 2012-2022 ($Million)
Table 65.United Arab Emirates Heat Transfer Fluids Market, By Product, 2012-2022 ($Million)
Table 66.United Arab Emirates Heat Transfer Fluids Market, By Application, 2012-2022 ($Million)
Table 67.Others Heat Transfer Fluids Market, By Product, 2012-2022 ($Million)
Table 68.Others Heat Transfer Fluids Market, By Application, 2012-2022 ($Million)
Table 69.The Dow Chemical Company: Key Strategic Developments, 2017-2017
Table 70.Exxon Mobil Corporation: Key Strategic Developments, 2017-2017
Table 71.BASF SE: Key Strategic Developments, 2017-2017
Table 72.Chevron Corporation: Key Strategic Developments, 2017-2017
Table 73.Honeywell International Inc.: Key Strategic Developments, 2017-2017
Table 74.Conoco Phillips: Key Strategic Developments, 2017-2017
Table 75.Eastman Chemical Company: Key Strategic Developments, 2017-2017
Table 76.Royal Dutch Shell plc: Key Strategic Developments, 2017-2017
Table 77.Dynalene Inc.: Key Strategic Developments, 2017-2017
Table 78.Indian Oil Corporation Ltd. (IOCL): Key Strategic Developments, 2017-2017
Table 79.Kost USA, Inc.: Key Strategic Developments, 2017-2017
List of Figures
Figure 1.Global Heat Transfer Fluids Market Share, By Product, 2017 & 2025
Figure 2.Global Heat Transfer Fluids Market, By Application, 2017, ($Million)
Figure 3.Global Heat Transfer Fluids Market, By Region, 2017, ($Million)
Figure 4.Exxon Mobil Corporation: Net Revenues, 2017-2017 ($Million)
Figure 5.Exxon Mobil Corporation: Net Revenue Share, By Segment, 2017
Figure 6.Exxon Mobil Corporation: Net Revenue Share, By Geography, 2017
Figure 7.BASF SE: Net Revenues, 2017-2017 ($Million)
Figure 8.BASF SE: Net Revenue Share, By Segment, 2017
Figure 9.BASF SE: Net Revenue Share, By Geography, 2017
Figure 10.Chevron Corporation: Net Revenues, 2017-2017 ($Million)
Figure 11.Chevron Corporation: Net Revenue Share, By Segment, 2017
Figure 12.Chevron Corporation: Net Revenue Share, By Geography, 2017
Figure 13.Indian Oil Corporation Ltd. (IOCL): Net Revenues, 2017-2017 ($Million)
Figure 14.Indian Oil Corporation Ltd. (IOCL): Net Revenue Share, By Segment, 2017
Figure 15.Indian Oil Corporation Ltd. (IOCL): Net Revenue Share, By Geography, 2017
Figure 16.Honeywell International Inc.: Net Revenues, 2017-2017 ($Million)
Figure 17.Honeywell International Inc.: Net Revenue Share, By Segment, 2017
Figure 18.Honeywell International Inc.: Net Revenue Share, By Geography, 2017
Research Methodology
We use both primary as well as secondary research for our market surveys, estimates and for developing forecast. Our research process commence by analyzing the problem which enable us to design the scope for our research study. Our research process is uniquely designed with enough flexibility to adjust according to changing nature of products and markets, while retaining core element to ensure reliability and accuracy in research findings. We understand both macro and micro-economic factors to evaluate and forecast different market segments.
Data Mining
Data is extensively collected through various secondary sources such as annual reports, investor presentations, SEC filings, and other corporate publications. We also refer trade magazines, technical journals, paid databases such as Factiva and Bloomberg, industry trade journals, scientific journals, and social media data to understand market dynamics and industry trends. Further, we also conduct primary research to understand market drivers, restraints, opportunities, challenges, and competitive scenario to build our analysis.
Data Collection Matrix
|
Data Collection Matrix |
Supply Side |
Demand Side |
|
Primary Data Sources |
|
|
|
Secondary Data Sources |
|
|
Market Modeling and Forecasting
We use epidemiology and capital equipment-based models to forecast market size of different segments at country and regional level.
- Epidemiology-based Forecasting Model: This method uses epidemiology data gathered through various publications and from physicians to estimate population of patients, flow of treatment of individual disease and therapies. The data collected through this method includes statics on incidence of disease, population suffering from disease, and treatment population. This method is used to understand:
- Number of patients for particular device or medical procedure and
- Repeated use of particular device depending on health and condition of patient
- Capital-based Forecasting Model: This method of forecasting is based on number of replacements, installed-based and new sales of capital equipment used in various healthcare and diagnostic centers. These three parameters are calculated and forecast is developed. Installation base is calculated as average number of units per facility; while sales for particular year is calculated from number of new and replace units. Secondary data is collected through various supply chain intermediaries and opinion leaders to arrive at installation and sales rate. These techniques help our analysts in validating market and developed market estimates and forecast.
We do forecast on basis of several parameters such as market drivers, market opportunities, industry trends government regulations, raw materials supply and trade dynamics to ensure relevance of forecast with market scenario. With increasing need to granulized information, we used bottom-up methodology for forecasting where we evaluate each regional segment differently and combined all forecast to develop final market forecast.
Data Validation
We believe primary research is a very important tool in analyzing and forecasting different markets. In order to make sure accuracy of our findings, our team conducts primary interviews at every stage of research to gain deep insights into current business environment and future trends and key developments in market. This includes use of various methods such as telephonic interviews, focus groups, face to face interviews and questionnaires to validate our research from all aspects. We validate our data through primary research from key industry leaders such as CEO, product managers, marketing managers, suppliers, distributors, and consumers are frequently interviewed. These interviews provide valuable insights which help us to have better market understanding besides validating our estimates and forecast.
Data Triangulation

Industry Analysis
|
Qualitative Data |
Quantitative Data (2017-2025) |
|
|