Gold Nanoparticles Market by End Users - Global Industry Analysis and Forecast to 2027
Published On : September 2017 Pages : 80 Category: Advanced Materials Report Code : CM09230
Industry Trend Analysis
The Gold Nanoparticles market was valued around USD 1.36 billion in 2017 and is expected to reach roughly USD 6.79 billion by the end of 2022 while registering itself at a compound annual growth rate (CAGR) of 19.25% during the forecast period, owing to innovations in the nanotechnology field together with rising requirements of metallic nanoparticles in many end user industries. Growing demand for diagnostics and therapeutics that are based on nanotechnology in the healthcare industry is likely to boost the growth of gold nanoparticles market across the forecast years. Technological innovations in the nanotechnology field for therapeutic diagnostics are also expected to affect the performance and quality of finished yields. Increasing demand for nanotech products, particularly for the treatment as well as diagnosis of cancer and tumor, has contributed to the expansion of metallic nanoparticles for medicine delivery systems. International nanotechnology market has experienced an augment in intellectual property filings regarding nanoparticles technology and nanowires targeting cancer. Increasing funds in Research and development together with aforementioned trends are anticipated to impact gold nanoparticles market positively over the coming few years. The gold nanoparticles are used for various applications in numerous other industries like chemical catalysis and electronics. Soaring demand for compact volume storage media gadgets with high-efficiency such as DVDs, CDs, flash cards and USB drives has resulted in the rise in the metal nanoparticles applications. Superior stability and inferior crystal growth of particles render gold nanoparticles a rim over other metallic nanoparticles like platinum and silver. However, stringent guidelines and standards for handling, sales and manufacturing of nanomaterials by global agencies like Nanomaterials Registry, National Institute of Standards and Technology (NIST) and International Organization for Standardization (ISO). Rising cases of gold nanoparticles toxicity might impact the environment and human health adversely and also expose the global market to reconsideration of standards and strict regulations. Biogenesis of these gold nanoparticles together with the development of niche uses such as glass tinting, fruit protection and photovoltaic might assist gold nanoparticles market to survive with the challenges mentioned above.
Application Outlook and Trend Analysis
In 2017, Dentistry & Medical was the major end-use industry and described for around 50% of global gold nanoparticles market. Growing application scale of nanomaterials in therapeutics, medical imaging, and diagnostics has been the key driving factors for gold nanoparticles demand. Rising research and development expenditure for cancer targeting drug delivery systems and nanoparticle technology is expected to impact gold nanoparticles market growth positively over the next few years. Global nanotechnology demand for therapeutic products had a growth at a compound annual growth rate of 17% during the period of 2009 to 2017, and the section is projected to demonstrate parallel growth during the next few years. This elevated nanotechnology growth in medical products coupled with rising application extent of gold nanoparticles in analytical tests for an extensive range of illness including HIV/AIDS, cardiovascular diseases, and cancer is expected to fuel global medical industry demand over the next few years. The electronics sector is predicted to have the maximum growth rates during the forecast years because of rising demand for increasing nanotechnology usage in photovoltaic and compact storage devices. The development of niche applications like nanowires for biosensors and vegetable & fruit protection is anticipated to create vast potential growth opportunities for global gold nanoparticles market.
Regional Outlook and Trend Analysis
In 2017, North America region was the major market and described for around 30% share of global gold nanoparticles market. The regional market in this area is distinguished by huge investments in research and development by single universities and nanotechnology firms together with the expansion of medical diagnostics market in the North America region. North America was complied by Asia Pacific region concerning revenue. Asia Pacific region is the major electronics manufacturing part regularized by the expansion of nanotechnology in economies like Korea, China, Taiwan, and India. The development of photovoltaic industry and high precision printing is also anticipated to sustain the growth of the market for gold nanoparticles in this area. Europe region is projected to experience sluggish growth during the forecast period.
Competitive Outlook and Trend Analysis
Global gold nanoparticles market is distinguished by high rivalry amid the industry players and low production joined with elevated investments in research and development. The market players race for precise end-user applications on the basis of product improvement. Key manufacturers in global gold nanoparticles market involve Cytodiagnostics, Inc., BBI Solutions, Goldsol, Nanopartz Inc., NanoHybrids Corp., Nanosphere, Inc., Nanostellar, Inc., Metalor Technologies SA, Tanaka Holdings Co., Ltd., Solaris Nanosciences Corporation, Innova Biosciences Ltd., NanoRods LLC, Nanobio Delivery Pharmaceutical Co., Ltd., Apollo Biolife and Sigma-Aldrich Corporation.
The global gold nanoparticles market is segmented as follows –
By Application
- Medical & dentistry
- Electronics
- Catalysis
- Others (Glass, Cosmetics & Photometry)
By Region
- North America
- Canada
- U.S
- Mexico
- Europe
- Spain
- Germany
- UK
- France
- Italy
- Rest of Europe
- Asia-Pacific
- Japan
- India
- China
- Australia
- South Korea
- Rest of Asia Pacific
- Rest of the World
- Brazil
- United Arab Emirates
- South Africa
- Saudi Arabia
- Others
Some of the key questions answered by the report are:
- What was the market size in 2017 and forecast from 2017 to 2022?
- What will be the industry market growth from 2017 to 2022?
- What are the major drivers, restraints, opportunities, challenges, and industry trends and their impact on the market forecast?
- What are the major segments leading the market growth and why?
- Which are the leading players in the market and what are the major strategies adopted by them to sustain the market competition?
Market Classification
- Gold Nanoparticles Market, By Application, Estimates and Forecast, 2014-2022 ($Million)
- Medical & dentistry
- Electronics
- Catalysis
- Other Applications
- Gold Nanoparticles Market, By Region, Estimates and Forecast, 2014-2022 ($Million)
- North America
- North America Gold Nanoparticles Market, By Country
- North America Gold Nanoparticles Market, By Application
- U.S. Gold Nanoparticles Market, By Application
- Canada Gold Nanoparticles Market, By Application
- Mexico Gold Nanoparticles Market, By Application
-
- Europe
- Europe Gold Nanoparticles Market, By Country
- Europe Gold Nanoparticles Market, By Application
- Germany Gold Nanoparticles Market, By Application
- France Gold Nanoparticles Market, By Application
- UK Gold Nanoparticles Market, By Application
- Italy Gold Nanoparticles Market, By Application
- Spain Gold Nanoparticles Market, By Application
- Rest of Europe Gold Nanoparticles Market, By Application
-
- Asia-Pacific
- Asia-Pacific Gold Nanoparticles Market, By Country
- Asia-Pacific Gold Nanoparticles Market, By Application
- Japan Gold Nanoparticles Market, By Application
- Australia Gold Nanoparticles Market, By Application
- India Gold Nanoparticles Market, By Application
- South Korea Gold Nanoparticles Market, By Application
- Rest of Asia-Pacific Gold Nanoparticles Market, By Application
- Asia-Pacific
-
- Rest of the World
- Rest of the World Gold Nanoparticles Market, By Country
- Rest of the World Gold Nanoparticles Market, By Application
- Brazil Gold Nanoparticles Market, By Application
- South Africa Gold Nanoparticles Market, By Application
- Saudi Arabia Gold Nanoparticles Market, By Application
- Turkey Gold Nanoparticles Market, By Application
- United Arab Emirates Gold Nanoparticles Market, By Application
- Others Gold Nanoparticles Market, By Application
- Rest of the World
Table of Contents
1.Introduction
1.1.Report Description
1.2.Research Methodology
1.2.1. Secondary Research
1.2.2. Primary Research
2.Executive Summary
2.1.Key Highlights
3.Market Overview
3.1.Introduction
3.1.1. Market Definition
3.1.2. Market Segmentation
3.2.Market Share Analysis
3.3.Market Dynamics
3.3.1. Drivers
3.3.1.1.Growing Research and Development in gold nanotechnology
3.3.1.2.Growing application of nanotechnology in medical diagnostics
3.3.1.3.Rising demand from electronics & development of niche applications
3.3.2. Restraints
3.3.2.1.Strict guidelines and standards for nanomaterial
3.3.3. Opportunities
3.3.3.1.Development of Advanced Devices with Better optimization Capabilities
3.4.Industry Trends
4.Gold Nanoparticles Market, By Application
4.1.Introduction
4.2.Gold Nanoparticles Market Assessment and Forecast, By Application, 2017-2022
4.3.Medical & dentistry
4.3.1.1.Market Assessment and Forecast, By Region, 2017-2022 ($Million)
4.4.Electronics
4.4.1.1.Market Assessment and Forecast, By Region, 2017-2022 ($Million)
4.5.Catalysis
4.5.1.1.Market Assessment and Forecast, By Region, 2017-2022 ($Million)
4.6.Other Applications
4.6.1.1.Market Assessment and Forecast, By Region, 2017-2022 ($Million)
5.Gold Nanoparticles Market, By Region
5.1.Introduction
5.2.Gold Nanoparticles Market Assessment and Forecast, By Region, 2017-2022 ($Million)
5.3.North America
5.3.1. Market Assessment and Forecast, By Application, 2017-2022 ($Million)
5.3.1.1.U.S.
5.3.1.1.1.Market Assessment and Forecast, By Application, 2017-2022 ($Million)
5.3.1.2.Canada
5.3.1.2.1.Market Assessment and Forecast, By Application, 2017-2022 ($Million)
5.3.1.3.Mexico
5.3.1.3.1.Market Assessment and Forecast, By Application, 2017-2022 ($Million)
5.4.Europe
5.4.1. Market Assessment and Forecast, By Country, 2017-2022 ($Million)
5.4.2. Market Assessment and Forecast, By Application, 2017-2022 ($Million)
5.4.2.1.Germany
5.4.2.1.1.Market Assessment and Forecast, By Application, 2017-2022 ($Million)
5.4.2.2.France
5.4.2.2.1.Market Assessment and Forecast, By Type, 2017-2022 ($Million)
5.4.2.3.UK
5.4.2.3.1.Market Assessment and Forecast, By Application, 2017-2022 ($Million)
5.4.2.4.Italy
5.4.2.4.1.Market Assessment and Forecast, By Application, 2017-2022 ($Million)
5.4.2.5.Spain
5.4.2.5.1.Market Assessment and Forecast, By Application, 2017-2022 ($Million)
5.4.2.6.Russia
5.4.2.6.1.Market Assessment and Forecast, By Application, 2017-2022 ($Million)
5.4.2.7.Rest of Europe
5.4.2.7.1.Market Assessment and Forecast, By Application, 2017-2022 ($Million)
5.5.Asia-Pacific
5.5.1. Market Assessment and Forecast, By Country, 2017-2022 ($Million)
5.5.2. Market Assessment and Forecast, By Application, 2017-2022 ($Million)
5.5.2.1.Japan
5.5.2.1.1.Market Assessment and Forecast, By Application, 2017-2022 ($Million)
5.5.2.2.China
5.5.2.2.1.Market Assessment and Forecast, By Application, 2017-2022 ($Million)
5.5.2.3.Australia
5.5.2.3.1.Market Assessment and Forecast, By Application, 2017-2022 ($Million)
5.5.2.4.India
5.5.2.4.1.Market Assessment and Forecast, By Application, 2017-2022 ($Million)
5.5.2.5.South Korea
5.5.2.5.1.Market Assessment and Forecast, By Application, 2017-2022 ($Million)
5.5.2.6.Taiwan
5.5.2.6.1.Market Assessment and Forecast, By Application, 2017-2022 ($Million)
5.5.2.7.Rest of Asia-Pacific
5.5.2.7.1.Market Assessment and Forecast, By Application, 2017-2022 ($Million)
5.6.Rest of the World
5.6.1. Market Assessment and Forecast, By Country, 2017-2022 ($Million)
5.6.2. Market Assessment and Forecast, By Application, 2017-2022 ($Million)
5.6.2.1.Brazil
5.6.2.1.1.Market Assessment and Forecast, By Application, 2017-2022 ($Million)
5.6.2.2.Turkey
5.6.2.2.1.Market Assessment and Forecast, By Application, 2017-2022 ($Million)
5.6.2.3.Saudi Arabia
5.6.2.3.1.Market Assessment and Forecast, By Application, 2017-2022 ($Million)
5.6.2.4.South Africa
5.6.2.4.1.Market Assessment and Forecast, By Application, 2017-2022 ($Million)
5.6.2.5.United Arab Emirates
5.6.2.5.1.Market Assessment and Forecast, By Application, 2017-2022 ($Million)
5.6.2.6.Others
5.6.2.6.1.Market Assessment and Forecast, By Application, 2017-2022 ($Million)
6.Company Profiles
6.1.Cytodiagnostics
6.1.1. Business Overview
6.1.2. Product Portfolio
6.1.3. Strategic Developments
6.2.BBI Solutions
6.2.1. Business Overview
6.2.2. Product Portfolio
6.2.3. Strategic Developments
6.3.NanoHybrids Corp.
6.3.1. Business Overview
6.3.2. Product Portfolio
6.3.3. Strategic Developments
6.4.Goldsol
6.4.1. Business Overview
6.4.2. Product Portfolio
6.4.3. Strategic Developments
6.5.Nanopartz Inc.
6.5.1. Business Overview
6.5.2. Product Portfolio
6.5.3. Strategic Developments
6.6.TANAKA HOLDINGS Co.
6.6.1. Business Overview
6.6.2. Product Portfolio
6.6.3. Strategic Developments
6.7.Solaris Nanoscinces
6.7.1. Business Overview
6.7.2. Product Portfolio
6.7.3. Strategic Developments
6.8.Innova Biosciences Ltd.
6.8.1. Business Overview
6.8.2. Product Portfolio
6.8.3. Strategic Developments
6.9.Sigma-Aldrich Co. LLC.
6.9.1. Business Overview
6.9.2. Product Portfolio
6.9.3. Strategic Developments
6.10.NanoRods LLC
6.10.1.Business Overview
6.10.2.Product Portfolio
6.10.3.Strategic Developments
List of Tables
Table 1.Gold Nanoparticles Market, By Application ($Million), 2017-2022
Table 2.Medical & dentistry Market, By Region ($Million), 2017-2022
Table 3.Electronics Market, By Region ($Million), 2017-2022
Table 4.Catalysis Market, By Region ($Million), 2017-2022
Table 5.Other Applications Market, By Region ($Million), 2017-2022
Table 6.Gold Nanoparticles Market, By Region ($Million), 2017-2022
Table 7.North America Gold Nanoparticles Market, By Country, 2017-2022 ($Million)
Table 8.North America Gold Nanoparticles Market, By Application, 2017-2022 ($Million)
Table 9.U.S. Gold Nanoparticles Market, By Application, 2017-2022 ($Million)
Table 10.Canada Gold Nanoparticles Market, By Application, 2017-2022 ($Million)
Table 11.Mexico Gold Nanoparticles Market, By Application, 2017-2022 ($Million)
Table 12.Europe Gold Nanoparticles Market, By Country, 2017-2022 ($Million)
Table 13.Europe Gold Nanoparticles Market, By Application, 2017-2022 ($Million)
Table 14.Germany Gold Nanoparticles Market, By Application, 2017-2022 ($Million)
Table 15.France Gold Nanoparticles Market, By Application, 2017-2022 ($Million)
Table 16.UK Gold Nanoparticles Market, By Application, 2017-2022 ($Million)
Table 17.Italy Gold Nanoparticles Market, By Application, 2017-2022 ($Million)
Table 18.Spain Gold Nanoparticles Market, By Application, 2017-2022 ($Million)
Table 19.Russia Gold Nanoparticles Market, By Application, 2017-2022 ($Million)
Table 20.Rest of Europe Gold Nanoparticles Market, By Application, 2017-2022 ($Million)
Table 21.Asia-Pacific Gold Nanoparticles Market, By Country, 2017-2022 ($Million)
Table 22.Asia-Pacific Gold Nanoparticles Market, By Application, 2017-2022 ($Million)
Table 23.Japan Gold Nanoparticles Market, By Application, 2017-2022 ($Million)
Table 24.China Gold Nanoparticles Market, By Application, 2017-2022 ($Million)
Table 25.Australia Gold Nanoparticles Market, By Application, 2017-2022 ($Million)
Table 26.India Gold Nanoparticles Market, By Application, 2017-2022 ($Million)
Table 27.South Korea Gold Nanoparticles Market, By Application, 2017-2022 ($Million)
Table 28.Taiwan Gold Nanoparticles Market, By Application, 2017-2022 ($Million)
Table 29.Rest of Asia-Pacific Gold Nanoparticles Market, By Application, 2017-2022 ($Million)
Table 30.Rest of the World Gold Nanoparticles Market, By Country, 2017-2022 ($Million)
Table 31.Rest of the World Gold Nanoparticles Market, By Application, 2017-2022 ($Million)
Table 32.Brazil Gold Nanoparticles Market, By Application, 2017-2022 ($Million)
Table 33.Turkey Gold Nanoparticles Market, By Application, 2017-2022 ($Million)
Table 34.Saudi Arabia Gold Nanoparticles Market, By Application, 2017-2022 ($Million)
Table 35.South Africa Gold Nanoparticles Market, By Application, 2017-2022 ($Million)
Table 36.United Arab Emirates Gold Nanoparticles Market, By Application, 2017-2022 ($Million)
Table 37.Others Gold Nanoparticles Market, By Application, 2017-2022 ($Million)
Table 38.Cytodiagnostics: Key Strategic Developments, 2017-2017
Table 39.BBI Solutions: Key Strategic Developments, 2017-2017
Table 40.NanoHybrids Corp.: Key Strategic Developments, 2017-2017
Table 41.Goldsol: Key Strategic Developments, 2017-2017
Table 42.Nanopartz Inc.: Key Strategic Developments, 2017-2017
Table 43.TANAKA HOLDINGS Co.: Key Strategic Developments, 2017-2017
Table 44.Solaris Nanoscinces: Key Strategic Developments, 2017-2017
Table 45.Innova Biosciences Ltd.: Key Strategic Developments, 2017-2017
Table 46.Sigma-Aldrich Co. LLC.: Key Strategic Developments, 2017-2017
Table 47.NanoRods LLC: Key Strategic Developments, 2017-2017
List of Figures
Figure 1.Gold Nanoparticles Market, By Application, 2017 & 2022 ($Million)
Figure 2.Gold Nanoparticles Market, By Region, 2017, ($Million)
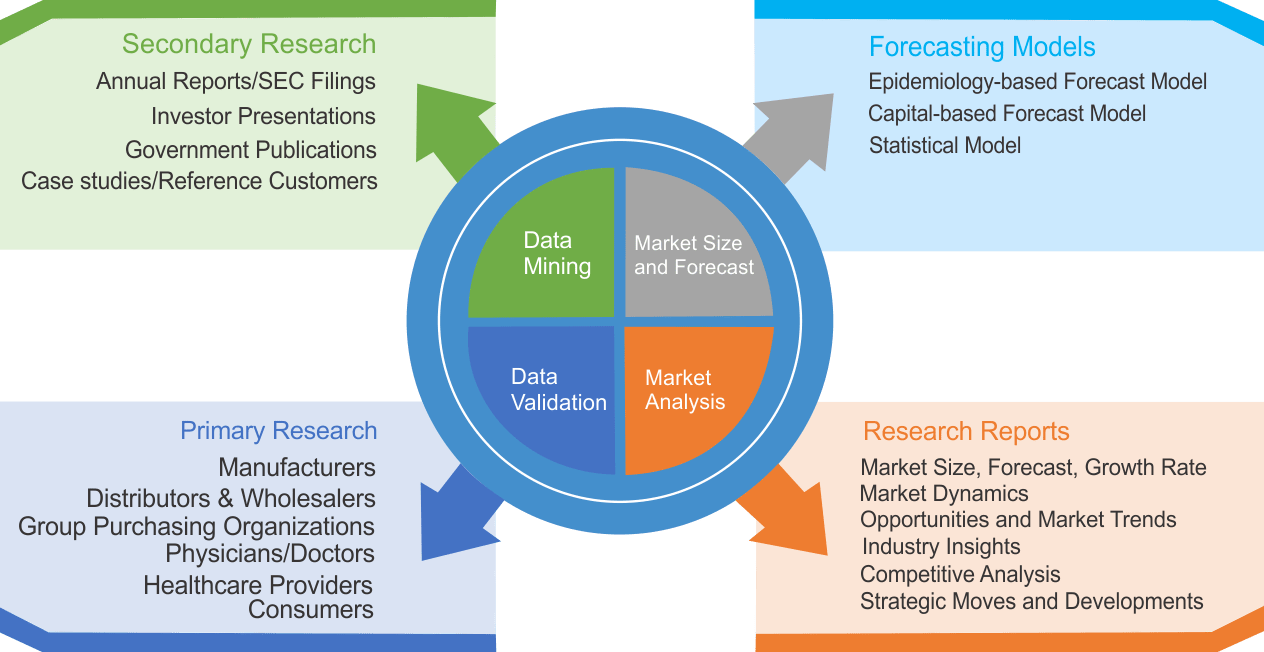
Research Methodology
We use both primary as well as secondary research for our market surveys, estimates and for developing forecast. Our research process commence by analyzing the problem which enable us to design the scope for our research study. Our research process is uniquely designed with enough flexibility to adjust according to changing nature of products and markets, while retaining core element to ensure reliability and accuracy in research findings. We understand both macro and micro-economic factors to evaluate and forecast different market segments.
Data Mining
Data is extensively collected through various secondary sources such as annual reports, investor presentations, SEC filings, and other corporate publications. We also refer trade magazines, technical journals, paid databases such as Factiva and Bloomberg, industry trade journals, scientific journals, and social media data to understand market dynamics and industry trends. Further, we also conduct primary research to understand market drivers, restraints, opportunities, challenges, and competitive scenario to build our analysis.
Data Collection Matrix
|
Data Collection Matrix |
Supply Side |
Demand Side |
|
Primary Data Sources |
|
|
|
Secondary Data Sources |
|
|
Market Modeling and Forecasting
We use epidemiology and capital equipment-based models to forecast market size of different segments at country and regional level.
- Epidemiology-based Forecasting Model: This method uses epidemiology data gathered through various publications and from physicians to estimate population of patients, flow of treatment of individual disease and therapies. The data collected through this method includes statics on incidence of disease, population suffering from disease, and treatment population. This method is used to understand:
- Number of patients for particular device or medical procedure and
- Repeated use of particular device depending on health and condition of patient
- Capital-based Forecasting Model: This method of forecasting is based on number of replacements, installed-based and new sales of capital equipment used in various healthcare and diagnostic centers. These three parameters are calculated and forecast is developed. Installation base is calculated as average number of units per facility; while sales for particular year is calculated from number of new and replace units. Secondary data is collected through various supply chain intermediaries and opinion leaders to arrive at installation and sales rate. These techniques help our analysts in validating market and developed market estimates and forecast.
We do forecast on basis of several parameters such as market drivers, market opportunities, industry trends government regulations, raw materials supply and trade dynamics to ensure relevance of forecast with market scenario. With increasing need to granulized information, we used bottom-up methodology for forecasting where we evaluate each regional segment differently and combined all forecast to develop final market forecast.
Data Validation
We believe primary research is a very important tool in analyzing and forecasting different markets. In order to make sure accuracy of our findings, our team conducts primary interviews at every stage of research to gain deep insights into current business environment and future trends and key developments in market. This includes use of various methods such as telephonic interviews, focus groups, face to face interviews and questionnaires to validate our research from all aspects. We validate our data through primary research from key industry leaders such as CEO, product managers, marketing managers, suppliers, distributors, and consumers are frequently interviewed. These interviews provide valuable insights which help us to have better market understanding besides validating our estimates and forecast.
Data Triangulation
Industry Analysis
|
Qualitative Data |
Quantitative Data (2017-2025) |
|
|