Glycerol Market by Source and Application - Global Industry Analysis and Forecast to 2022
Published On : September 2017 Pages : 120 Category: Renewable Chemicals Report Code : CM09224
Industry Outlook and Trend Analysis
The glycerol market was valued around USD 1.89 billion in 2017 and is expected to reach roughly USD 3.07 billion by the end of 2022 while registering itself at a compound annual growth rate (CAGR) of 5.44% during the forecast period. Glycerol is a sweet, thick, colorless sugar polyol compound showing hygroscopic and solvent properties. It is also known as glycerin and it is an essential constituent of all the triglycerides. Glycerol can be natural or synthetic relying upon the raw materials utilized for its manufacturing. Some of the glycerol manufacturing procedures include hydrolysis, transesterification, and saponification. Glycerol contains high nutrition values and excellent non-toxicity that makes it widely useful in various consumer products. It is utilized in various applications such as to antifreeze chemicals and explosives, food sweeteners and preservatives, widely relying on its chemical features. Prevailing applications of biofuels and rising requirement of oleochemicals are anticipated to boost the growth of this market. It is potential as a stage synthetic for inexhaustible chemicals generation hold scope as interchange alternatives are investigated for efficient plausibility. However, unstable supply of feedstock may hamper the growth of this market. Low edges for refining procedures may additionally prevent the market development.
Source Outlook and Trend analysis
Previously, glycerol was exclusively retrieved by synthetic procedures. However, biodiesel has become a prime source of glycerol in the recent years. This can be credited to the development of transesterification process i.e., the way toward utilizing biodiesel/greasy liquor for the production of glycerol. Moreover, synthetic procedures are known to be economically impractical when taken into consideration for manufacturing on a large scale. Being a side-effect of biodiesel, glycerol supply has ascended with expanded exploration of biodiesel alternatives.
Application Outlook and Trend analysis
The dominant application segment for the global glycerol market is personal care. Due to its healing properties and nutritive value, glycerol is widely utilized in several skin care products. Additionally, its aperient and sweet tasting characteristics make it useful in a number of health products. The developing paints and coatings industry additionally demands glycerol contribution to the type of alkyd saps as feedstock. The application segment of polyether polyols has also been developing with the growing usage of sweeteners that are low in calorie for products like chewing gums. Other applications in which glycerol is utilized include explosive production, food preserving, tobacco humectants, perfume production and pharmaceuticals.
Downstream Opportunity Outlook and Trend Analysis
Glycerol holds potential as a synthetic stage for the inexhaustible generation of chemicals. It acts as an eco-friendly and economical substitute. Propylene Glycol, Epichlorohydrin, and 1-3 propanediol are couple of chemicals that have experienced procedures of being fabricated from glycerols.
Regional Outlook and Trend Analysis
The major consumer in the global glycerol market has been Europe in various segments such as food & beverages, personal care and pharmaceuticals. Utilization of glycerol as a raw material has increased for the manufacturing of propylene glycol and epichlorohydrin. Owing to rising manufacturing of epichlorohydrin from glycerol the consumption rate of China are anticipated to rise. With its advanced paints and coatings market, Middle East areas' requirement for glycerol is needed to be significant for alkyd saps and unified items. With rising implementation of cosmetic and pharmaceutical products that contain glycerol the global market is expected to witness significant growth.
Competitive Insights
The global glycerol market contains several major companies such as United Coconut Chemicals, Incorporated, Wilmar International, Procter and Gamble Chemicals, Dow Chemical Company, Kao Corporation, Solvay S.A, Twin Rivers Technologies, Pacific Oleochemicals Sdn Bhd, Godrej Group, Henkel North American Consumer Goods, Emery Oleochemicals, Sakamoto Yakuhin Kogyo Company Ltd, Archer Daniels Midland, Vitusa Products Inc and Croda International.
The global glycerol market is segmented as follows-
By Source
- Fatty alcohols
- Biodiesel
- Fatty acids
- Soap industry
By Application
- Polyether polyols
- Personal care & pharmaceuticals
- Tobacco humectants
- Foods & beverages
- Alkyd Resins
- Others
By Region
- North America
- U.S
- Canada
- Mexico
- Europe
- Germany
- France
- UK
- Italy
- Spain
- Rest of Europe
- Asia-Pacific
- Japan
- China
- Australia
- India
- South Korea
- Rest of Asia Pacific
- Rest of the World
- Brazil
- South Africa
- Saudi Arabia
- United Arab Emirates
- Others
Some of the key questions answered by the report are:
- What was the market size in 2017 and forecast from 2017 to 2022?
- What will be the industry market growth from 2017 to 2022?
- What are the major drivers, restraints, opportunities, challenges, and industry trends and their impact on the market forecast?
- What are the major segments leading the market growth and why?
- Which are the leading players in the market and what are the major strategies adopted by them to sustain the market competition?
Market Classification
- Glycerol Market, By Source, Estimates and Forecast, 2014-2022 ($Million)
- Fatty alcohols
- Biodiesel
- Fatty acids
- Soap industry
- Glycerol Market, By Application, Estimates and Forecast, 2014-2022 ($Million)
- Polyether polyols
- Personal care & pharmaceuticals
- Tobacco humectants
- Foods & beverages
- Alkyd Resins
- Other Applications
- Glycerol Market, By Region, Estimates and Forecast, 2014-2022 ($Million)
- North America
- North America Glycerol Market, By Country
- North America Glycerol Market, By Source
- North America Glycerol Market, By Application
- U.S. Glycerol Market, By Source
- U.S. Glycerol Market, By Application
- Canada Glycerol Market, By Source
- Canada Glycerol Market, By Application
- Mexico Glycerol Market, By Source
- Mexico Glycerol Market, By Application
-
- Europe
- Europe Glycerol Market, By Country
- Europe Glycerol Market, By Source
- Europe Glycerol Market, By Application
- Germany Glycerol Market, By Source
- Germany Glycerol Market, By Application
- France Glycerol Market, By Source
- France Glycerol Market, By Application
- UK Glycerol Market, By Source
- UK Glycerol Market, By Application
- Italy Glycerol Market, By Source
- Italy Glycerol Market, By Application
- Spain Glycerol Market, By Source
- Spain Glycerol Market, By Application
- Rest of Europe Glycerol Market, By Source
- Rest of Europe Glycerol Market, By Application
-
- Asia-Pacific
- Asia-Pacific Glycerol Market, By Country
- Asia-Pacific Glycerol Market, By Source
- Asia-Pacific Glycerol Market, By Application
- Japan Glycerol Market, By Source
- Japan Glycerol Market, By Application
- Australia Glycerol Market, By Source
- Australia Glycerol Market, By Application
- India Glycerol Market, By Source
- India Glycerol Market, By Application
- South Korea Glycerol Market, By Source
- South Korea Glycerol Market, By Application
- Rest of Asia-Pacific Glycerol Market, By Source
- Rest of Asia-Pacific Glycerol Market, By Application
- Asia-Pacific
-
- Rest of the World
- Rest of the World Glycerol Market, By Country
- Rest of the World Glycerol Market, By Source
- Rest of the World Glycerol Market, By Application
- Brazil Glycerol Market, By Source
- Brazil Glycerol Market, By Application
- South Africa Glycerol Market, By Source
- South Africa Glycerol Market, By Application
- Saudi Arabia Glycerol Market, By Source
- Saudi Arabia Glycerol Market, By Application
- Turkey Glycerol Market, By Source
- Turkey Glycerol Market, By Application
- United Arab Emirates Glycerol Market, By Source
- United Arab Emirates Glycerol Market, By Application
- Others Glycerol Market, By Source
- Others Glycerol Market, By Application
- Rest of the World
Table of Contents
1.Introduction
1.1.Report Description
1.2.Research Methodology
1.2.1. Secondary Research
1.2.2. Primary Research
2.Executive Summary
2.1.Key Highlights
3.Market Overview
3.1.Introduction
3.1.1. Market Definition
3.1.2. Market Segmentation
3.2.Market Share Analysis
3.3.Market Dynamics
3.3.1. Drivers
3.3.1.1.Practical, environmental friendly substitution
3.3.1.2.Rising Demand for Biodiesel
3.3.1.3.Upsurge in demand of various consumer application segments
3.3.2. Restraints
3.3.2.1.Low profitability
3.3.2.2.Uncertain glycerol supply
3.3.3. Opportunities
3.3.3.1.Development in newapplications
3.4.Industry Trends
4.Glycerol Market, By Source
4.1.Introduction
4.2.Glycerol Market Assessment and Forecast, By Source, 2017-2022
4.3.Fatty alcohols
4.3.1. Market Assessment and Forecast, By Region, 2017-2022 ($Million)
4.4.Biodiesel
4.4.1. Market Assessment and Forecast, By Region, 2017-2022 ($Million)
4.5.Fatty acids
4.5.1. Market Assessment and Forecast, By Region, 2017-2022 ($Million)
4.6.Soap industry
4.6.1. Market Assessment and Forecast, By Region, 2017-2022 ($Million)
5.Glycerol Market, By Application
5.1.Introduction
5.2.Glycerol Market Assessment and Forecast, By Application, 2017-2022
5.3.Polyether polyols
5.3.1.1.Market Assessment and Forecast, By Region, 2017-2022 ($Million)
5.4.Personal care & pharmaceuticals
5.4.1.1.Market Assessment and Forecast, By Region, 2017-2022 ($Million)
5.5.Tobacco humectants
5.5.1.1.Market Assessment and Forecast, By Region, 2017-2022 ($Million)
5.6.Foods & beverages
5.6.1.1.Market Assessment and Forecast, By Region, 2017-2022 ($Million)
5.7.Alkyd Resins
5.7.1.1.Market Assessment and Forecast, By Region, 2017-2022 ($Million)
5.8.Other Applications
5.8.1.1.Market Assessment and Forecast, By Region, 2017-2022 ($Million)
6.Glycerol Market, By Region
6.1.Introduction
6.2.Glycerol Market Assessment and Forecast, By Region, 2017-2022 ($Million)
6.3.North America
6.3.1. Market Assessment and Forecast, By Country, 2017-2022 ($Million)
6.3.2. Market Assessment and Forecast, By Source, 2017-2022 ($Million)
6.3.3. Market Assessment and Forecast, By Application, 2017-2022 ($Million)
6.3.3.1.U.S.
6.3.3.1.1.Market Assessment and Forecast, By Source, 2017-2022 ($Million)
6.3.3.1.2.Market Assessment and Forecast, By Application, 2017-2022 ($Million)
6.3.3.2.Canada
6.3.3.2.1.Market Assessment and Forecast, By Source, 2017-2022 ($Million)
6.3.3.2.2.Market Assessment and Forecast, By Application, 2017-2022 ($Million)
6.3.3.3.Mexico
6.3.3.3.1.Market Assessment and Forecast, By Source, 2017-2022 ($Million)
6.3.3.3.2.Market Assessment and Forecast, By Application, 2017-2022 ($Million)
6.4.Europe
6.4.1. Market Assessment and Forecast, By Country, 2017-2022 ($Million)
6.4.2. Market Assessment and Forecast, By Source, 2017-2022 ($Million)
6.4.3. Market Assessment and Forecast, By Application, 2017-2022 ($Million)
6.4.3.1.Germany
6.4.3.1.1.Market Assessment and Forecast, By Source, 2017-2022 ($Million)
6.4.3.1.2.Market Assessment and Forecast, By Application, 2017-2022 ($Million)
6.4.3.2.France
6.4.3.2.1.Market Assessment and Forecast, By Source, 2017-2022 ($Million)
6.4.3.2.2.Market Assessment and Forecast, By Source, 2017-2022 ($Million)
6.4.3.3.UK
6.4.3.3.1.Market Assessment and Forecast, By Source, 2017-2022 ($Million)
6.4.3.3.2.Market Assessment and Forecast, By Application, 2017-2022 ($Million)
6.4.3.4.Italy
6.4.3.4.1.Market Assessment and Forecast, By Source, 2017-2022 ($Million)
6.4.3.4.2.Market Assessment and Forecast, By Application, 2017-2022 ($Million)
6.4.3.5.Spain
6.4.3.5.1.Market Assessment and Forecast, By Source, 2017-2022 ($Million)
6.4.3.5.2.Market Assessment and Forecast, By Application, 2017-2022 ($Million)
6.4.3.6.Russia
6.4.3.6.1.Market Assessment and Forecast, By Source, 2017-2022 ($Million)
6.4.3.6.2.Market Assessment and Forecast, By Application, 2017-2022 ($Million)
6.4.3.7.Rest of Europe
6.4.3.7.1.Market Assessment and Forecast, By Source, 2017-2022 ($Million)
6.4.3.7.2.Market Assessment and Forecast, By Application, 2017-2022 ($Million)
6.5.Asia-Pacific
6.5.1. Market Assessment and Forecast, By Country, 2017-2022 ($Million)
6.5.2. Market Assessment and Forecast, By Source, 2017-2022 ($Million)
6.5.3. Market Assessment and Forecast, By Application, 2017-2022 ($Million)
6.5.3.1.Japan
6.5.3.1.1.Market Assessment and Forecast, By Source, 2017-2022 ($Million)
6.5.3.1.2.Market Assessment and Forecast, By Application, 2017-2022 ($Million)
6.5.3.2.China
6.5.3.2.1.Market Assessment and Forecast, By Source, 2017-2022 ($Million)
6.5.3.2.2.Market Assessment and Forecast, By Application, 2017-2022 ($Million)
6.5.3.3.Australia
6.5.3.3.1.Market Assessment and Forecast, By Source, 2017-2022 ($Million)
6.5.3.3.2.Market Assessment and Forecast, By Application, 2017-2022 ($Million)
6.5.3.4.India
6.5.3.4.1.Market Assessment and Forecast, By Source, 2017-2022 ($Million)
6.5.3.4.2.Market Assessment and Forecast, By Application, 2017-2022 ($Million)
6.5.3.5.South Korea
6.5.3.5.1.Market Assessment and Forecast, By Source, 2017-2022 ($Million)
6.5.3.5.2.Market Assessment and Forecast, By Application, 2017-2022 ($Million)
6.5.3.6.Taiwan
6.5.3.6.1.Market Assessment and Forecast, By Source, 2017-2022 ($Million)
6.5.3.6.2.Market Assessment and Forecast, By Application, 2017-2022 ($Million)
6.5.3.7.Rest of Asia-Pacific
6.5.3.7.1.Market Assessment and Forecast, By Source, 2017-2022 ($Million)
6.5.3.7.2.Market Assessment and Forecast, By Application, 2017-2022 ($Million)
6.6.Rest of the World
6.6.1. Market Assessment and Forecast, By Country, 2017-2022 ($Million)
6.6.2. Market Assessment and Forecast, By Source, 2017-2022 ($Million)
6.6.3. Market Assessment and Forecast, By Application, 2017-2022 ($Million)
6.6.3.1.Brazil
6.6.3.1.1.Market Assessment and Forecast, By Source, 2017-2022 ($Million)
6.6.3.1.2.Market Assessment and Forecast, By Application, 2017-2022 ($Million)
6.6.3.2.Turkey
6.6.3.2.1.Market Assessment and Forecast, By Source, 2017-2022 ($Million)
6.6.3.2.2.Market Assessment and Forecast, By Application, 2017-2022 ($Million)
6.6.3.3.Saudi Arabia
6.6.3.3.1.Market Assessment and Forecast, By Source, 2017-2022 ($Million)
6.6.3.3.2.Market Assessment and Forecast, By Application, 2017-2022 ($Million)
6.6.3.4.South Africa
6.6.3.4.1.Market Assessment and Forecast, By Source, 2017-2022 ($Million)
6.6.3.4.2.Market Assessment and Forecast, By Application, 2017-2022 ($Million)
6.6.3.5.United Arab Emirates
6.6.3.5.1.Market Assessment and Forecast, By Source, 2017-2022 ($Million)
6.6.3.5.2.Market Assessment and Forecast, By Application, 2017-2022 ($Million)
6.6.3.6.Others
6.6.3.6.1.Market Assessment and Forecast, By Source, 2017-2022 ($Million)
6.6.3.6.2.Market Assessment and Forecast, By Application, 2017-2022 ($Million)
7.Company Profiles
7.1.Solvay S.A.
7.1.1. Business Overview
7.1.2. Product Portfolio
7.1.3. Key Financials
7.1.4. Strategic Developments
7.2.Wilmar International
7.2.1. Business Overview
7.2.2. Product Portfolio
7.2.3. Key Financials
7.2.4. Strategic Developments
7.3.Procter & Gamble Chemicals
7.3.1. Business Overview
7.3.2. Product Portfolio
7.3.3. Key Financials
7.3.4. Strategic Developments
7.4.BASF SE
7.4.1. Business Overview
7.4.2. Product Portfolio
7.4.3. Key Financials
7.4.4. Strategic Developments
7.5.Kuala Lumpur Kepong Berhad
7.5.1. Business Overview
7.5.2. Product Portfolio
7.5.3. Key Financials
7.5.4. Strategic Developments
7.6.Dow Chemical Company
7.6.1. Business Overview
7.6.2. Product Portfolio
7.6.3. Key Financials
7.6.4. Strategic Developments
7.7.Godrej Industries Ltd.
7.7.1. Business Overview
7.7.2. Product Portfolio
7.7.3. Key Financials
7.7.4. Strategic Developments
7.8.IOI Oleochemical Industries Berhad
7.8.1. Business Overview
7.8.2. Product Portfolio
7.8.3. Key Financials
7.8.4. Strategic Developments
7.9.Croda International Plc
7.9.1. Business Overview
7.9.2. Product Portfolio
7.9.3. Key Financials
7.9.4. Strategic Developments
7.10.Archer Daniel Midland
7.10.1.Business Overview
7.10.2.Product Portfolio
7.10.3.Key Financials
7.10.4.Strategic Developments
7.11.Sakamoto Yakuhin Kogyo Company Ltd.
7.11.1.Business Overview
7.11.2.Product Portfolio
7.11.3.Strategic Developments
7.12.Pacific Oleochemicals Sdn. Bhd.
7.12.1.Business Overview
7.12.2.Product Portfolio
7.12.3.Strategic Developments
7.13.Kao Corporation
7.13.1.Business Overview
7.13.2.Product Portfolio
7.13.3.Key Financials
7.13.4.Strategic Developments
7.14.Pt Cisadane Raya Chemicals
7.14.1.Business Overview
7.14.2.Product Portfolio
7.14.3.Strategic Developments
7.15.Emery Oleochemicals LLC
7.15.1.Business Overview
7.15.2.Product Portfolio
7.15.3.Strategic Developments
7.16.Twin Rivers Technologies, Inc.
7.16.1.Business Overview
7.16.2.Product Portfolio
7.16.3.Strategic Developments
List of Tables
Table 1.Glycerol Market, By Source ($Million), 2017-2022
Table 2.Fatty alcohols Market, By Region ($Million), 2017-2022
Table 3.Biodiesel Market, By Region ($Million), 2017-2022
Table 4.Fatty acids Market, By Region ($Million), 2017-2022
Table 5.Soap industry, By Region ($Million), 2017-2022
Table 6.Glycerol Market, By Application ($Million), 2017-2022
Table 7.Polyether polyols Market, By Region ($Million), 2017-2022
Table 8.Personal care & pharmaceuticals Market, By Region ($Million), 2017-2022
Table 9.Tobacco humectants Market, By Region ($Million), 2017-2022
Table 10.Foods & beverages Market, By Region ($Million), 2017-2022
Table 11.Alkyd Resins Market, By Region ($Million), 2017-2022
Table 12.Other Applications Market, By Region ($Million), 2017-2022
Table 13.Glycerol Market, By Region ($Million), 2017-2022
Table 14.North America Glycerol Market, By Country, 2017-2022 ($Million)
Table 15.North America Glycerol Market, By Source, 2017-2022 ($Million)
Table 15.North America Glycerol Market, By Application, 2017-2022 ($Million)
Table 17.U.S. Glycerol Market, By Source, 2017-2022 ($Million)
Table 18.U.S. Glycerol Market, By Application, 2017-2022 ($Million)
Table 19.Canada Glycerol Market, By Source, 2017-2022 ($Million)
Table 20.Canada Glycerol Market, By Application, 2017-2022 ($Million)
Table 21.Mexico Glycerol Market, By Source, 2017-2022 ($Million)
Table 22.Mexico Glycerol Market, By Application, 2017-2022 ($Million)
Table 23.Europe Glycerol Market, By Country, 2017-2022 ($Million)
Table 24.Europe Glycerol Market, By Source, 2017-2022 ($Million)
Table 25.Europe Glycerol Market, By Application, 2017-2022 ($Million)
Table 26.Germany Glycerol Market, By Source, 2017-2022 ($Million)
Table 27.Germany Glycerol Market, By Application, 2017-2022 ($Million)
Table 28.France Glycerol Market, By Source, 2017-2022 ($Million)
Table 29.France Glycerol Market, By Application, 2017-2022 ($Million)
Table 30.UK Glycerol Market, By Source, 2017-2022 ($Million)
Table 31.UK Glycerol Market, By Application, 2017-2022 ($Million)
Table 32.Italy Glycerol Market, By Source, 2017-2022 ($Million)
Table 33.Italy Glycerol Market, By Application, 2017-2022 ($Million)
Table 34.Spain Glycerol Market, By Source, 2017-2022 ($Million)
Table 35.Spain Glycerol Market, By Application, 2017-2022 ($Million)
Table 36.Russia Glycerol Market, By Source, 2017-2022 ($Million)
Table 37.Russia Glycerol Market, By Application, 2017-2022 ($Million)
Table 38.Rest of Europe Glycerol Market, By Source, 2017-2022 ($Million)
Table 39.Rest of Europe Glycerol Market, By Application, 2017-2022 ($Million)
Table 40.Asia-Pacific Glycerol Market, By Country, 2017-2022 ($Million)
Table 41.Asia-Pacific Glycerol Market, By Source, 2017-2022 ($Million)
Table 42.Asia-Pacific Glycerol Market, By Application, 2017-2022 ($Million)
Table 43.Japan Glycerol Market, By Source, 2017-2022 ($Million)
Table 44.Japan Glycerol Market, By Application, 2017-2022 ($Million)
Table 45.China Glycerol Market, By Source, 2017-2022 ($Million)
Table 46.China Glycerol Market, By Application, 2017-2022 ($Million)
Table 47.Australia Glycerol Market, By Source, 2017-2022 ($Million)
Table 48.Australia Glycerol Market, By Application, 2017-2022 ($Million)
Table 49.India Glycerol Market, By Source, 2017-2022 ($Million)
Table 50.India Glycerol Market, By Application, 2017-2022 ($Million)
Table 51.South Korea Glycerol Market, By Source, 2017-2022 ($Million)
Table 52.South Korea Glycerol Market, By Application, 2017-2022 ($Million)
Table 53.Taiwan Glycerol Market, By Source, 2017-2022 ($Million)
Table 54.Taiwan Glycerol Market, By Application, 2017-2022 ($Million)
Table 55.Rest of Asia-Pacific Glycerol Market, By Source, 2017-2022 ($Million)
Table 56.Rest of Asia-Pacific Glycerol Market, By Application, 2017-2022 ($Million)
Table 57.Rest of the World Glycerol Market, By Country, 2017-2022 ($Million)
Table 58.Rest of the World Glycerol Market, By Source, 2017-2022 ($Million)
Table 59.Rest of the World Glycerol Market, By Application, 2017-2022 ($Million)
Table 60.Brazil Glycerol Market, By Source, 2017-2022 ($Million)
Table 61.Brazil Glycerol Market, By Application, 2017-2022 ($Million)
Table 62.Turkey Glycerol Market, By Source, 2017-2022 ($Million)
Table 63.Turkey Glycerol Market, By Application, 2017-2022 ($Million)
Table 64.Saudi Arabia Glycerol Market, By Source, 2017-2022 ($Million)
Table 65.Saudi Arabia Glycerol Market, By Application, 2017-2022 ($Million)
Table 66.South Africa Glycerol Market, By Source, 2017-2022 ($Million)
Table 67.South Africa Glycerol Market, By Application, 2017-2022 ($Million)
Table 68.United Arab Emirates Glycerol Market, By Source, 2017-2022 ($Million)
Table 69.United Arab Emirates Glycerol Market, By Application, 2017-2022 ($Million)
Table 70.Others Glycerol Market, By Source, 2017-2022 ($Million)
Table 71.Others Glycerol Market, By Application, 2017-2022 ($Million)
Table 72.Solvay S.A.: Key Strategic Developments, 2017-2017
Table 73.Wilmar International: Key Strategic Developments, 2017-2017
Table 74.Procter & Gamble Chemicals: Key Strategic Developments, 2017-2017
Table 75.BASF SE: Key Strategic Developments, 2017-2017
Table 76.Kuala Lumpur Kepong Berhad: Key Strategic Developments, 2017-2017
Table 77.Dow Chemical Company: Key Strategic Developments, 2017-2017
Table 78.Godrej Industries Ltd.: Key Strategic Developments, 2017-2017
Table 79.IOI Oleochemical Industries Berhad: Key Strategic Developments, 2017-2017
Table 80.Croda International Plc: Key Strategic Developments, 2017-2017
Table 81.Archer Daniel Midland: Key Strategic Developments, 2017-2017
Table 82.Sakamoto Yakuhin Kogyo Company Ltd.: Key Strategic Developments, 2017-2017
Table 83.Pacific Oleochemicals Sdn. Bhd.: Key Strategic Developments, 2017-2017
Table 84.Kao Corporation: Key Strategic Developments, 2017-2017
Table 85.Pt Cisadane Raya Chemicals: Key Strategic Developments, 2017-2017
Table 86.Emery Oleochemicals LLC: Key Strategic Developments, 2017-2017
Table 87.Twin Rivers Technologies, Inc.: Key Strategic Developments, 2017-2017
List of Figures
Figure 1.Glycerol Market Share, By Source, 2017 & 2022 ($Million)
Figure 2.Glycerol Market, By Application, 2017 & 2022 ($Million)
Figure 3.Glycerol Market, By Region, 2017, ($Million)
Figure 4.Solvay S.A.: Net Revenues, 2017-2017 ($Million)
Figure 5.Solvay S.A.: Net Revenue Share, By Segment, 2017
Figure 6.Solvay S.A.: Net Revenue Share, By Geography, 2017
Figure 7.Wilmar International: Net Revenues, 2017-2017 ($Million)
Figure 8.Wilmar International: Net Revenue Share, By Segment, 2017
Figure 9.Wilmar International: Net Revenue Share, By Geography, 2017
Figure 10.Procter & Gamble Chemicals: Net Revenues, 2017-2017 ($Million)
Figure 11.Procter & Gamble Chemicals: Net Revenue Share, By Segment, 2017
Figure 12.Procter & Gamble Chemicals: Net Revenue Share, By Geography, 2017
Figure 13.BASF SE: Net Revenues, 2017-2017 ($Million)
Figure 14.BASF SE: Net Revenue Share, By Segment, 2017
Figure 15.BASF SE: Net Revenue Share, By Geography, 2017
Figure 16.Kuala Lumpur Kepong Berhad: Net Revenues, 2017-2017 ($Million)
Figure 17.Kuala Lumpur Kepong Berhad: Net Revenue Share, By Segment, 2017
Figure 18.Kuala Lumpur Kepong Berhad: Net Revenue Share, By Geography, 2017
Figure 19.Dow Chemical Company: Net Revenues, 2017-2017 ($Million)
Figure 20.Dow Chemical Company: Net Revenue Share, By Segment, 2017
Figure 21.Dow Chemical Company: Net Revenue Share, By Geography, 2017
Figure 22.Godrej Industries Ltd.: Net Revenues, 2017-2017 ($Million)
Figure 23.Godrej Industries Ltd.: Net Revenue Share, By Segment, 2017
Figure 24.Godrej Industries Ltd.: Net Revenue Share, By Geography, 2017
Figure 25.IOI Oleochemical Industries Berhad: Net Revenues, 2017-2017 ($Million)
Figure 26.IOI Oleochemical Industries Berhad: Net Revenue Share, By Segment, 2017
Figure 27.IOI Oleochemical Industries Berhad: Net Revenue Share, By Geography, 2017
Figure 28.Croda International Plc: Net Revenues, 2017-2017 ($Million)
Figure 29.Croda International Plc: Net Revenue Share, By Segment, 2017
Figure 30.Croda International Plc: Net Revenue Share, By Geography, 2017
Figure 31.Archer Daniel Midland: Net Revenues, 2017-2017 ($Million)
Figure 32.Archer Daniel Midland: Net Revenue Share, By Segment, 2017
Figure 33.Archer Daniel Midland: Net Revenue Share, By Geography, 2017
Figure 34.Kao Corporation: Net Revenues, 2017-2017 ($Million)
Figure 35.Kao Corporation: Net Revenue Share, By Segment, 2017
Figure 36.Kao Corporation: Net Revenue Share, By Geography, 2017
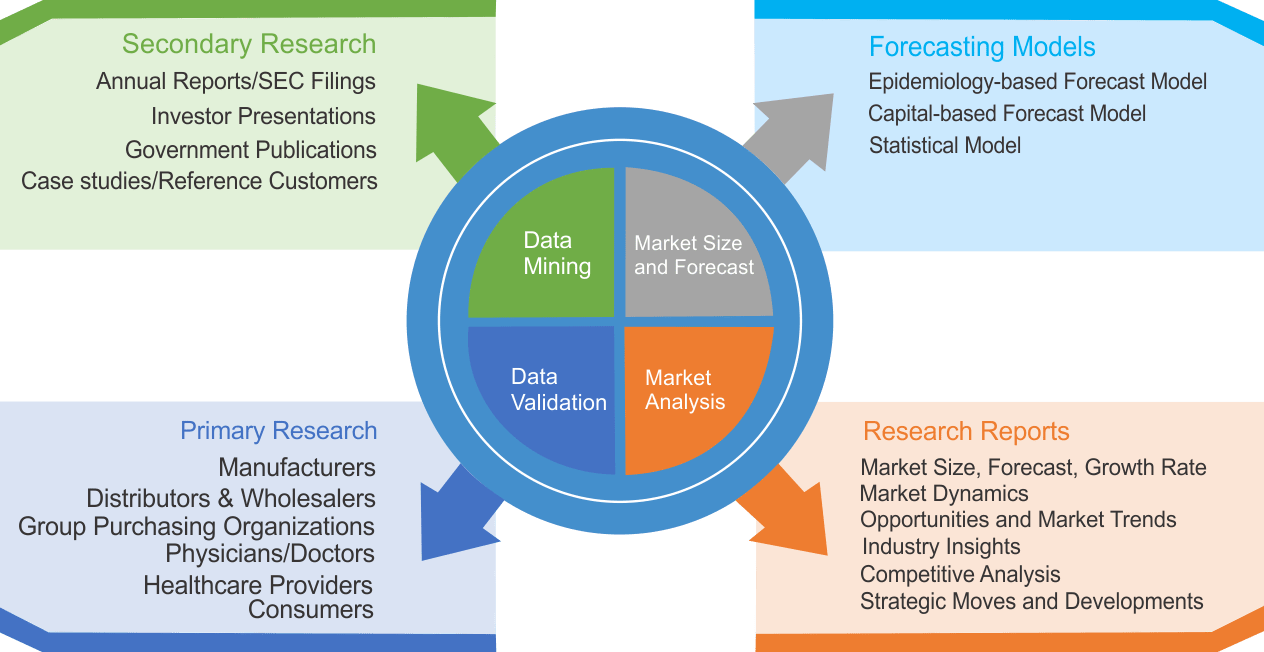
Research Methodology
We use both primary as well as secondary research for our market surveys, estimates and for developing forecast. Our research process commence by analyzing the problem which enable us to design the scope for our research study. Our research process is uniquely designed with enough flexibility to adjust according to changing nature of products and markets, while retaining core element to ensure reliability and accuracy in research findings. We understand both macro and micro-economic factors to evaluate and forecast different market segments.
Data Mining
Data is extensively collected through various secondary sources such as annual reports, investor presentations, SEC filings, and other corporate publications. We also refer trade magazines, technical journals, paid databases such as Factiva and Bloomberg, industry trade journals, scientific journals, and social media data to understand market dynamics and industry trends. Further, we also conduct primary research to understand market drivers, restraints, opportunities, challenges, and competitive scenario to build our analysis.
Data Collection Matrix
|
Data Collection Matrix |
Supply Side |
Demand Side |
|
Primary Data Sources |
|
|
|
Secondary Data Sources |
|
|
Market Modeling and Forecasting
We use epidemiology and capital equipment-based models to forecast market size of different segments at country and regional level.
- Epidemiology-based Forecasting Model: This method uses epidemiology data gathered through various publications and from physicians to estimate population of patients, flow of treatment of individual disease and therapies. The data collected through this method includes statics on incidence of disease, population suffering from disease, and treatment population. This method is used to understand:
- Number of patients for particular device or medical procedure and
- Repeated use of particular device depending on health and condition of patient
- Capital-based Forecasting Model: This method of forecasting is based on number of replacements, installed-based and new sales of capital equipment used in various healthcare and diagnostic centers. These three parameters are calculated and forecast is developed. Installation base is calculated as average number of units per facility; while sales for particular year is calculated from number of new and replace units. Secondary data is collected through various supply chain intermediaries and opinion leaders to arrive at installation and sales rate. These techniques help our analysts in validating market and developed market estimates and forecast.
We do forecast on basis of several parameters such as market drivers, market opportunities, industry trends government regulations, raw materials supply and trade dynamics to ensure relevance of forecast with market scenario. With increasing need to granulized information, we used bottom-up methodology for forecasting where we evaluate each regional segment differently and combined all forecast to develop final market forecast.
Data Validation
We believe primary research is a very important tool in analyzing and forecasting different markets. In order to make sure accuracy of our findings, our team conducts primary interviews at every stage of research to gain deep insights into current business environment and future trends and key developments in market. This includes use of various methods such as telephonic interviews, focus groups, face to face interviews and questionnaires to validate our research from all aspects. We validate our data through primary research from key industry leaders such as CEO, product managers, marketing managers, suppliers, distributors, and consumers are frequently interviewed. These interviews provide valuable insights which help us to have better market understanding besides validating our estimates and forecast.
Data Triangulation
Industry Analysis
|
Qualitative Data |
Quantitative Data (2017-2025) |
|
|