Gas Sensors Market by Product, Technology and End User - Global Industry Analysis and Forecast to 2022
Published On : October 2017 Pages : 107 Category: Sensors & Controls Report Code : SE10305
Industry Trend Analysis
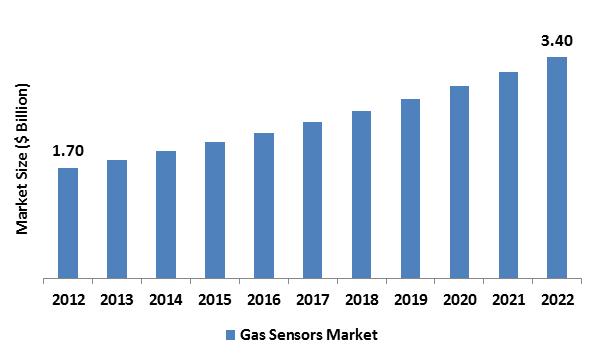
In 2017, the global gas sensors market was valued around USD 1.70 billion and is anticipated to reach approximately USD 3.40 billion while maintaining a compound annual growth rate (CAGR) of 6.45% during the forecast period. Technology advancements, largely owing to improved embedded electronics and manufacturing processes are anticipated to fuel the growth of the global gas sensors market. For instance, in the automobile sector, harmful emissions have contributed to the composing of regulations for emission control and produced the requirement to monitoring its concentration. NOx and CO sensors are installed with this intention, hence bestowing towards the growth of global market revenue. Oxygen sensors are installed in vehicles for monitoring cabin air quality. Different types of toxic and combustible substances used in manufacturing processes like NO2 (Nitrogen Dioxide), H2S (Hydrogen Sulfide), etc. present an elevated risk for people in the surrounding area. Hence, it is essential to constantly supervise their concentration in industrial surroundings to prevent any mishaps. Demand for these sensors so as to ensure occupational safety and health is on the augment over several industry segments like manufacturing and process industries. Rising adoption of smart and wireless sensing technologies is anticipated to drive the growth of the global gas sensors market during the forecast years.
Product Outlook and Trend Analysis
In 2017, oxygen sensors reported for 10% of the global market revenue and are anticipated to achieve market share during the projected period. The products sensing carbon dioxide have been experiencing rising demand from the mass food storage segment as they are skilled for detecting initial spoilage as well as obtaining CO2 levels in controlled packages and storage structures. High cost for CO2 detecting products is anticipated to hamper the growth of this segment during the next few years. Carbon monoxide is produced owing to partial combustion of carbon-based compounds and their high concentration is hazardous for humans. CO sensors identify the density of the gas and help in precluding toxic conditions in industrial environments.
Technology Outlook and Trend Analysis
Devices based on PID technology are primarily used in detecting hydrogen sulfide, ammonia, Volatile Organic Compounds (VOCs), etc. Consequently, they are perfect for applications like control and monitoring of leak detection and decontamination in confined spaces and closed rooms. Catalytic sensors are comparatively easy to calibrate and install elastic in nature and can be employed for supervising emissions over various applications. Products derived from this technology can be used over an extensive range of temperature. Solid state products are tough in nature; thus, they can be employed in corrosive surroundings. They can also function at elevated temperatures and are susceptible to alterations in concentration, which assist to monitor toxic emissions and explosions. Products based on thermal conductivity utilize filaments in an attempt to detect any changes happening in the target substance’s thermal conductivity.
End-user Outlook and Trend Analysis
End-user industries are building automation and domestic appliances, medical, industrial, automotive, petrochemical, and environmental. In 2017, environmental applications reported for 12% of the global market revenue. The industrial section is anticipated to continue ruling the global market in the approaching years, and supervise production processes and also preventing leaks. Gas sensing is necessary in the commercial and space for supervising harmful emissions as well as avoiding deficiency of oxygen.
Regional Outlook and Trend Analysis
In 2017, Asia Pacific regional gas sensors market was the top regional segment and reported for around 25% of global market revenue, largely owing to technological innovations in this region. Increasing demand for incorporated products utilized in hand-held equipment has also stimulated the market growth activities. Moreover, encouraging government regulations like the Wealth and Welfare, Industrial Safety Act are anticipated to drive regional market demand. Energy conservation initiatives and emission control standards are expected to support the market demand for the European automotive sector. Increasing uses of these devices and rising demand from end-user industries are also estimated to be the key growth drivers for this market.
Competitive Outlook and Trend Analysis
Key market players with a major share of the global gas sensors market are City Technology Ltd., Alphasense, Membrapor AG, Dynament Ltd., and Figaro Engineering. Product development is the key strategy followed by major market players. City Technology concentrates mainly on innovation and development capabilities and also follows strategies like investment in research and development; it invested extensively in process equipment and state-of-the-art automation to insure that their products are validated and manufactured to custom-made specifications. They have also set up a facility to manufacture and test its products along with the expansion of integrated electrochemical, optical, and pellistor technologies.
The global gas sensors market is segmented as follows:
By Product
- Carbon Dioxide Sensors
- Carbon Monoxide Sensors
- NOx Sensors
- Oxygen/Lambda Sensors
- Other Products
By Technology
- Solid State/MOS
- PID
- Catalytic
- Infrared (IR)
- Electrochemical
- Semiconductor
- Other Technologies
By End User
- Environmental
- Petrochemical
- Automotive
- Industrial
- Medical
- Building Automation & Domestic Appliances
- Other End User
By Region
- North America
- U.S
- Canada
- Mexico
- Europe
- Germany
- France
- UK
- Italy
- Spain
- Rest of Europe
- Asia-Pacific
- Japan
- China
- Australia
- India
- South Korea
- Rest of Asia Pacific
- Rest of the World
- Brazil
- South Africa
- Saudi Arabia
- United Arab Emirates
- Others
Some of the key questions answered by the report are:
- What was the market size in 2017 and forecast from 2017 to 2022?
- What will be the industry market growth from 2017 to 2022?
- What are the major drivers, restraints, opportunities, challenges, and industry trends and their impact on the market forecast?
- What are the major segments leading the market growth and why?
- Which are the leading players in the market and what are the major strategies adopted by them to sustain the market competition?
Market Classification
- Gas Sensors Market, By Product, Estimates and Forecast, 2012-2022 ($Million)
- Carbon Dioxide Sensors
- Carbon Monoxide Sensors
- NOx Sensors
- Oxygen/Lambda Sensors
- Other Products
- Gas Sensors Market, By Technology, Estimates and Forecast, 2012-2022 ($Million)
- Solid State/MOS
- PID
- Catalytic
- Infrared (IR)
- Electrochemical
- Semiconductor
- Other Technologies
- Gas Sensors Market, By End User, Estimates and Forecast, 2012-2022 ($Million)
- Environmental
- Petrochemical
- Automotive
- Industrial
- Medical
- Building Automation & Domestic Appliances
- Other End User
- Gas Sensors Market, By Region, Estimates and Forecast, 2012-2022 ($Million)
- North America
- North America Gas Sensors Market, By Country
- North America Gas Sensors Market, By Product
- North America Gas Sensors Market, By Technology
- North America Gas Sensors Market, By End User
- U.S. Gas Sensors Market, By Product
- U.S. Gas Sensors Market, By Technology
- U.S. Gas Sensors Market, By End User
- Canada Gas Sensors Market, By Product
- Canada Gas Sensors Market, By Technology
- Canada Gas Sensors Market, By End User
- Mexico Gas Sensors Market, By Product
- Mexico Gas Sensors Market, By Technology
- Mexico Gas Sensors Market, By End User
-
- Europe
- Europe Gas Sensors Market, By Country
- Europe Gas Sensors Market, By Product
- Europe Gas Sensors Market, By Technology
- Europe Gas Sensors Market, By End User
- Germany Gas Sensors Market, By Product
- Germany Gas Sensors Market, By Technology
- Germany Gas Sensors Market, By End User
- France Gas Sensors Market, By Product
- France Gas Sensors Market, By Technology
- France Gas Sensors Market, By End User
- UK Gas Sensors Market, By Product
- UK Gas Sensors Market, By Technology
- UK Gas Sensors Market, By End User
- Italy Gas Sensors Market, By Product
- Italy Gas Sensors Market, By Technology
- Italy Gas Sensors Market, By End User
- Spain Gas Sensors Market, By Product
- Spain Gas Sensors Market, By Technology
- Spain Gas Sensors Market, By End User
- Rest of Europe Gas Sensors Market, By Product
- Rest of Europe Gas Sensors Market, By Technology
- Rest of Europe Gas Sensors Market, By End User
-
- Asia-Pacific
- Asia-Pacific Gas Sensors Market, By Country
- Asia-Pacific Gas Sensors Market, By Product
- Asia-Pacific Gas Sensors Market, By Technology
- Asia-Pacific Gas Sensors Market, By End User
- Japan Gas Sensors Market, By Product
- Japan Gas Sensors Market, By Technology
- Japan Gas Sensors Market, By End User
- China Gas Sensors Market, By Product
- China Gas Sensors Market, By Technology
- China Gas Sensors Market, By End User
- Australia Gas Sensors Market, By Product
- Australia Gas Sensors Market, By Technology
- Australia Gas Sensors Market, By End User
- India Gas Sensors Market, By Product
- India Gas Sensors Market, By Technology
- India Gas Sensors Market, By End User
- South Korea Gas Sensors Market, By Product
- South Korea Gas Sensors Market, By Technology
- South Korea Gas Sensors Market, By End User
- Rest of Asia-Pacific Gas Sensors Market, By Product
- Rest of Asia-Pacific Gas Sensors Market, By Technology
- Rest of Asia-Pacific Gas Sensors Market, By End User
-
- Rest of the World
- Rest of the World Gas Sensors Market, By Country
- Rest of the World Gas Sensors Market, By Product
- Rest of the World Gas Sensors Market, By Technology
- Rest of the World Gas Sensors Market, By End User
- Brazil Gas Sensors Market, By Product
- Brazil Gas Sensors Market, By Technology
- Brazil Gas Sensors Market, By End User
- South Africa Gas Sensors Market, By Product
- South Africa Gas Sensors Market, By Technology
- South Africa Gas Sensors Market, By End User
- Saudi Arabia Gas Sensors Market, By Product
- Saudi Arabia Gas Sensors Market, By Technology
- Saudi Arabia Gas Sensors Market, By End User
- Turkey Gas Sensors Market, By Product
- Turkey Gas Sensors Market, By Technology
- Turkey Gas Sensors Market, By End User
- United Arab Emirates Gas Sensors Market, By Product
- United Arab Emirates Gas Sensors Market, By Technology
- United Arab Emirates Gas Sensors Market, By End User
- Others Gas Sensors Market, By Product
- Others Gas Sensors Market, By Technology
- Others Gas Sensors Market, By End User
Table of Contents
1. Introduction
1.1. Report Description
1.2. Research Methodology
1.2.1. Secondary Research
1.2.2. Primary Research
2. Executive Summary
2.1. Key Highlights
3. Market Overview
3.1. Introduction
3.1.1. Market Definition
3.1.2. Market Segmentation
3.2. Market Dynamics
3.2.1. Drivers
3.2.1.1. Expansion of Miniaturized Wireless Sensors
3.2.1.2. Rising Awareness of Air Quality Control Among Users
3.2.2. Restraints
3.2.2.1. Technical Issues Related to Energy Consumption, Sensitivity, and Stability
3.2.3. Opportunities
3.2.3.1. Growing Adoption of Gas Sensors in Consumer Electronics Application
4. Gas Sensors Market, By Product
4.1. Introduction
4.2. Gas Sensors Market Assessment and Forecast, By Product, 2012-2022
4.3. Carbon Dioxide Sensors
4.3.1. Market Assessment and Forecast, By Region, 2012-2022 ($Million)
4.4. Carbon Monoxide Sensors
4.4.1. Market Assessment and Forecast, By Region, 2012-2022 ($Million)
4.5. NOx Sensors
4.5.1. Market Assessment and Forecast, By Region, 2012-2022 ($Million)
4.6. Oxygen/Lambda Sensors
4.6.1. Market Assessment and Forecast, By Region, 2012-2022 ($Million)
4.7. Other Products
4.7.1. Market Assessment and Forecast, By Region, 2012-2022 ($Million)
5. Gas Sensors Market, By Technology
5.1. Introduction
5.2. Gas Sensors Market Assessment and Forecast, By Technology, 2012-2022
5.3. Solid State/MOS
5.3.1. Market Assessment and Forecast, By Region, 2012-2022 ($Million)
5.4. PID
5.4.1. Market Assessment and Forecast, By Region, 2012-2022 ($Million)
5.5. Catalytic
5.5.1. Market Assessment and Forecast, By Region, 2012-2022 ($Million)
5.6. Electrochemical
5.6.1. Market Assessment and Forecast, By Region, 2012-2022 ($Million)
5.7. Semiconductor
5.7.1. Market Assessment and Forecast, By Region, 2012-2022 ($Million)
5.8. Other Technologies
5.8.1. Market Assessment and Forecast, By Region, 2012-2022 ($Million)
6. Gas Sensors Market, By End User
6.1. Introduction
6.2. Gas Sensors Market Assessment and Forecast, By End User, 2012-2022 ($Million)
6.3. Environmental
6.3.1. Market Assessment and Forecast, By Region, 2012-2022 ($Million)
6.4. Petrochemical
6.4.1. Market Assessment and Forecast, By Region, 2012-2022 ($Million)
6.5. Automotive
6.5.1. Market Assessment and Forecast, By Region, 2012-2022 ($Million)
6.6. Industrial
6.6.1. Market Assessment and Forecast, By Region, 2012-2022 ($Million)
6.7. Medical
6.7.1. Market Assessment and Forecast, By Region, 2012-2022 ($Million)
6.8. Building Automation & Domestic Appliances
6.8.1. Market Assessment and Forecast, By Region, 2012-2022 ($Million)
6.9. Other End Users
6.9.1. Market Assessment and Forecast, By Region, 2012-2022 ($Million)
7. Gas Sensors Market, By Region
7.1. Introduction
7.2. Gas Sensors Market Assessment and Forecast, By Region, 2012-2022 ($Million)
7.3. North America
7.3.1. Market Assessment and Forecast, By Country, 2012-2022 ($Million)
7.3.2. Market Assessment and Forecast, By Product, 2012-2022 ($Million)
7.3.3. Market Assessment and Forecast, By Technology, 2012-2022 ($Million)
7.3.4. Market Assessment and Forecast, By End User, 2012-2022 ($Million)
7.3.4.1. U.S.
7.3.4.1.1. Market Assessment and Forecast, By Product, 2012-2022 ($Million)
7.3.4.1.2. Market Assessment and Forecast, By Technology, 2012-2022 ($Million)
7.3.4.1.3. Market Assessment and Forecast, By End User, 2012-2022 ($Million)
7.3.4.2. Canada
7.3.4.2.1. Market Assessment and Forecast, By Product, 2012-2022 ($Million)
7.3.4.2.2. Market Assessment and Forecast, By Technology, 2012-2022 ($Million)
7.3.4.2.3. Market Assessment and Forecast, By End User, 2012-2022 ($Million)
7.3.4.3. Mexico
7.3.4.3.1. Market Assessment and Forecast, By Product, 2012-2022 ($Million)
7.3.4.3.2. Market Assessment and Forecast, By Technology, 2012-2022 ($Million)
7.3.4.3.3. Market Assessment and Forecast, By End User, 2012-2022 ($Million)
7.4. Europe
7.4.1. Market Assessment and Forecast, By Country, 2012-2022 ($Million)
7.4.2. Market Assessment and Forecast, By Product, 2012-2022 ($Million)
7.4.3. Market Assessment and Forecast, By Technology, 2012-2022 ($Million)
7.4.4. Market Assessment and Forecast, By End User, 2012-2022 ($Million)
7.4.4.1. Germany
7.4.4.1.1. Market Assessment and Forecast, By Product, 2012-2022 ($Million)
7.4.4.1.2. Market Assessment and Forecast, By Technology, 2012-2022 ($Million)
7.4.4.1.3. Market Assessment and Forecast, By End User, 2012-2022 ($Million)
7.4.4.2. France
7.4.4.2.1. Market Assessment and Forecast, By Product, 2012-2022 ($Million)
7.4.4.2.2. Market Assessment and Forecast, By Technologys, 2012-2022 ($Million)
7.4.4.2.3. Market Assessment and Forecast, By End User, 2012-2022 ($Million)
7.4.4.3. UK
7.4.4.3.1. Market Assessment and Forecast, By Product, 2012-2022 ($Million)
7.4.4.3.2. Market Assessment and Forecast, By Technology, 2012-2022 ($Million)
7.4.4.3.3. Market Assessment and Forecast, By End User, 2012-2022 ($Million)
7.4.4.4. Italy
7.4.4.4.1. Market Assessment and Forecast, By Product, 2012-2022 ($Million)
7.4.4.4.2. Market Assessment and Forecast, By Technology, 2012-2022 ($Million)
7.4.4.4.3. Market Assessment and Forecast, By End User, 2012-2022 ($Million)
7.4.4.5. Spain
7.4.4.5.1. Market Assessment and Forecast, By Product, 2012-2022 ($Million)
7.4.4.5.2. Market Assessment and Forecast, By Technology, 2012-2022 ($Million)
7.4.4.5.3. Market Assessment and Forecast, By End User, 2012-2022 ($Million)
7.4.4.6. Rest of Europe
7.4.4.6.1. Market Assessment and Forecast, By Product, 2012-2022 ($Million)
7.4.4.6.2. Market Assessment and Forecast, By Technology, 2012-2022 ($Million)
7.4.4.6.3. Market Assessment and Forecast, By End User, 2012-2022 ($Million)
7.5. Asia-Pacific
7.5.1. Market Assessment and Forecast, By Country, 2012-2022 ($Million)
7.5.2. Market Assessment and Forecast, By Product, 2012-2022 ($Million)
7.5.3. Market Assessment and Forecast, By Technology, 2012-2022 ($Million)
7.5.4. Market Assessment and Forecast, By End User, 2012-2022 ($Million)
7.5.4.1. Japan
7.5.4.1.1. Market Assessment and Forecast, By Product, 2012-2022 ($Million)
7.5.4.1.2. Market Assessment and Forecast, By Technology, 2012-2022 ($Million)
7.5.4.1.3. Market Assessment and Forecast, By End User, 2012-2022 ($Million)
7.5.4.2. China
7.5.4.2.1. Market Assessment and Forecast, By Product, 2012-2022 ($Million)
7.5.4.2.2. Market Assessment and Forecast, By Technology, 2012-2022 ($Million)
7.5.4.2.3. Market Assessment and Forecast, By End User, 2012-2022 ($Million)
7.5.4.3. Australia
7.5.4.3.1. Market Assessment and Forecast, By Product, 2012-2022 ($Million)
7.5.4.3.2. Market Assessment and Forecast, By Technology, 2012-2022 ($Million)
7.5.4.3.3. Market Assessment and Forecast, By End User, 2012-2022 ($Million)
7.5.4.4. India
7.5.4.4.1. Market Assessment and Forecast, By Product, 2012-2022 ($Million)
7.5.4.4.2. Market Assessment and Forecast, By Technology, 2012-2022 ($Million)
7.5.4.4.3. Market Assessment and Forecast, By End User, 2012-2022 ($Million)
7.5.4.5. South Korea
7.5.4.5.1. Market Assessment and Forecast, By Product, 2012-2022 ($Million)
7.5.4.5.2. Market Assessment and Forecast, By Technology, 2012-2022 ($Million)
7.5.4.5.3. Market Assessment and Forecast, By End User, 2012-2022 ($Million)
7.5.4.6. Rest of Asia-Pacific
7.5.4.6.1. Market Assessment and Forecast, By Product, 2012-2022 ($Million)
7.5.4.6.2. Market Assessment and Forecast, By Technology, 2012-2022 ($Million)
7.5.4.6.3. Market Assessment and Forecast, By End User, 2012-2022 ($Million)
7.6. Rest of the World
7.6.1. Market Assessment and Forecast, By Country, 2012-2022 ($Million)
7.6.2. Market Assessment and Forecast, By Product, 2012-2022 ($Million)
7.6.3. Market Assessment and Forecast, By Technology, 2012-2022 ($Million)
7.6.4. Market Assessment and Forecast, By End User, 2012-2022 ($Million)
7.6.4.1. Brazil
7.6.4.1.1. Market Assessment and Forecast, By Product, 2012-2022 ($Million)
7.6.4.1.2. Market Assessment and Forecast, By Technology, 2012-2022 ($Million)
7.6.4.1.3. Market Assessment and Forecast, By End User, 2012-2022 ($Million)
7.6.4.2. Turkey
7.6.4.2.1. Market Assessment and Forecast, By Product, 2012-2022 ($Million)
7.6.4.2.2. Market Assessment and Forecast, By Technology, 2012-2022 ($Million)
7.6.4.2.3. Market Assessment and Forecast, By End User, 2012-2022 ($Million)
7.6.4.3. Saudi Arabia
7.6.4.3.1. Market Assessment and Forecast, By Product, 2012-2022 ($Million)
7.6.4.3.2. Market Assessment and Forecast, By Technology, 2012-2022 ($Million)
7.6.4.3.3. Market Assessment and Forecast, By End User, 2012-2022 ($Million)
7.6.4.4. South Africa
7.6.4.4.1. Market Assessment and Forecast, By Product, 2012-2022 ($Million)
7.6.4.4.2. Market Assessment and Forecast, By Technology, 2012-2022 ($Million)
7.6.4.4.3. Market Assessment and Forecast, By End User, 2012-2022 ($Million)
7.6.4.5. United Arab Emirates
7.6.4.5.1. Market Assessment and Forecast, By Product, 2012-2022 ($Million)
7.6.4.5.2. Market Assessment and Forecast, By Technology, 2012-2022 ($Million)
7.6.4.5.3. Market Assessment and Forecast, By End User, 2012-2022 ($Million)
7.6.4.6. Others
7.6.4.6.1. Market Assessment and Forecast, By Product, 2012-2022 ($Million)
7.6.4.6.2. Market Assessment and Forecast, By Technology, 2012-2022 ($Million)
7.6.4.6.3. Market Assessment and Forecast, By End User, 2012-2022 ($Million)
8. Company Profiles
8.1. Aeroqual Ltd.
8.1.1. Business Overview
8.1.2. Product Portfolio
8.1.3. Key Financials
8.1.4. Strategic Developments
8.2. ABB Ltd.
8.2.1. Business Overview
8.2.2. Product Portfolio
8.2.3. Key Financials
8.2.4. Strategic Developments
8.3. City Technology Ltd.
8.3.1. Business Overview
8.3.2. Product Portfolio
8.3.3. Key Financials
8.3.4. Strategic Developments
8.4. Figaro Engineering Inc.
8.4.1. Business Overview
8.4.2. Product Portfolio
8.4.3. Key Financials
8.4.4. Strategic Developments
8.5. Dynament Ltd
8.5.1. Business Overview
8.5.2. Product Portfolio
8.5.3. Key Financials
8.5.4. Strategic Developments
8.6. Alphanese
8.6.1. Business Overview
8.6.2. Product Portfolio
8.6.3. Strategic Developments
8.7. Dragerwerk AG & Co. KGaA
8.7.1. Business Overview
8.7.2. Product Portfolio
8.7.3. Key Financials
8.7.4. Strategic Developments
8.8. Membrapor AG
8.8.1. Business Overview
8.8.2. Product Portfolio
8.8.3. Strategic Developments
8.9. Robert Bosch, LLC
8.9.1. Business Overview
8.9.2. Product Portfolio
8.9.3. Key Financials
8.9.4. Strategic Developments
8.10. Siemens AG
8.10.1. Business Overview
8.10.2. Product Portfolio
8.10.3. Key Financials
8.10.4. Strategic Developments
8.11. Yokogawa Electric Corporation
8.11.1. Business Overview
8.11.2. Product Portfolio
8.11.3. Key Financials
8.11.4. Strategic Developments
8.12. Trolex Ltd
8.12.1. Business Overview
8.12.2. Product Portfolio
8.12.3. Strategic Developments
List of Tables
Table 1.Gas Sensors Market, By Product ($Million), 2012-2022
Table 2.Carbon Dioxide Sensors Market, By Region ($Million), 2012-2022
Table 3.Carbon Monoxide Sensors Market, By Region ($Million), 2012-2022
Table 4.NOx Sensors Market, By Region ($Million), 2012-2022
Table 5.Oxygen/Lambda Sensors Market, By Region ($Million), 2012-2022
Table 6.Other Products Market, By Region ($Million), 2012-2022
Table 7.Gas Sensors Market, By Technology ($Million), 2012-2022
Table 8.Solid State/MOS Market, By Region ($Million), 2012-2022
Table 9.PID Market, By Region ($Million), 2012-2022
Table 10.Catalytic Market, By Region ($Million), 2012-2022
Table 11.Infrared (IR) Market, By Region ($Million), 2012-2022
Table 12.Electrochemical Market, By Region ($Million), 2012-2022
Table 13.Semiconductor Market, By Region ($Million), 2012-2022
Table 14.Other Technologies Market, By Region ($Million), 2012-2022
Table 15.Gas Sensors Market, By End user ($Million), 2012-2022
Table 16.Environmental Market, By Region ($Million), 2012-2022
Table 17.Petrochemical Market, By Region ($Million), 2012-2022
Table 18.Automotive Market, By Region ($Million), 2012-2022
Table 19.Industrial Market, By Region ($Million), 2012-2022
Table 20.Medical Market, By Region ($Million), 2012-2022
Table 21.Building Automation & Domestic Appliances Market, By Region ($Million), 2012-2022
Table 22.Other End User Market, By Region ($Million), 2012-2022
Table 23.Gas Sensors Market, By Region ($Million), 2012-2022
Table 24.North America Gas Sensors Market, By Country, 2012-2022 ($Million)
Table 25.North America Gas Sensors Market, By Product, 2012-2022 ($Million)
Table 26.North America Gas Sensors Market, By Technology, 2012-2022 ($Million)
Table 27.North America Gas Sensors Market, By End User, 2012-2022 ($Million)
Table 28.U.S. Gas Sensors Market, By Product, 2012-2022 ($Million)
Table 29.U.S. Gas Sensors Market, By Technology, 2012-2022 ($Million)
Table 30.U.S. Gas Sensors Market, By End User, 2012-2022 ($Million)
Table 31.Canada Gas Sensors Market, By Product, 2012-2022 ($Million)
Table 32.Canada Gas Sensors Market, By Technology, 2012-2022 ($Million)
Table 33.Canada Gas Sensors Market, By End User, 2012-2022 ($Million)
Table 34.Mexico Gas Sensors Market, By Product, 2012-2022 ($Million)
Table 35.Mexico Gas Sensors Market, By Technology, 2012-2022 ($Million)
Table 36.Mexico Gas Sensors Market, By End User, 2012-2022 ($Million)
Table 37.Europe Gas Sensors Market, By Country, 2012-2022 ($Million)
Table 38.Europe Gas Sensors Market, By Product, 2012-2022 ($Million)
Table 39.Europe Gas Sensors Market, By Technology, 2012-2022 ($Million)
Table 40.Europe Gas Sensors Market, By End User, 2012-2022 ($Million)
Table 41.Germany Gas Sensors Market, By Product, 2012-2022 ($Million)
Table 42.Germany Gas Sensors Market, By Technology, 2012-2022 ($Million)
Table 43.Germany Gas Sensors Market, By End User, 2012-2022 ($Million)
Table 44.France Gas Sensors Market, By Product, 2012-2022 ($Million)
Table 45.France Gas Sensors Market, By Technology, 2012-2022 ($Million)
Table 46.France Gas Sensors Market, By End User, 2012-2022 ($Million)
Table 47.UK Gas Sensors Market, By Product, 2012-2022 ($Million)
Table 48.UK Gas Sensors Market, By Technology, 2012-2022 ($Million)
Table 49.UK Gas Sensors Market, By End User, 2012-2022 ($Million)
Table 50.Italy Gas Sensors Market, By Product, 2012-2022 ($Million)
Table 51.Italy Gas Sensors Market, By Technology, 2012-2022 ($Million)
Table 52.Italy Gas Sensors Market, By End User, 2012-2022 ($Million)
Table 53.Spain Gas Sensors Market, By Product, 2012-2022 ($Million)
Table 54.Spain Gas Sensors Market, By Technology, 2012-2022 ($Million)
Table 55.Spain Gas Sensors Market, By End User, 2012-2022 ($Million)
Table 56.Rest of Europe Gas Sensors Market, By Product, 2012-2022 ($Million)
Table 57.Rest of Europe Gas Sensors Market, By Technology, 2012-2022 ($Million)
Table 58.Rest of Europe Gas Sensors Market, By End User, 2012-2022 ($Million)
Table 59.Asia-Pacific Gas Sensors Market, By Country, 2012-2022 ($Million)
Table 60.Asia-Pacific Gas Sensors Market, By Product, 2012-2022 ($Million)
Table 61.Asia-Pacific Gas Sensors Market, By Technology, 2012-2022 ($Million)
Table 62.Asia-Pacific Gas Sensors Market, By End User, 2012-2022 ($Million)
Table 63.Japan Gas Sensors Market, By Product, 2012-2022 ($Million)
Table 64.Japan Gas Sensors Market, By Technology, 2012-2022 ($Million)
Table 65.Japan Gas Sensors Market, By End User, 2012-2022 ($Million)
Table 66.China Gas Sensors Market, By Product, 2012-2022 ($Million)
Table 67.China Gas Sensors Market, By Technology, 2012-2022 ($Million)
Table 68.China Gas Sensors Market, By End User, 2012-2022 ($Million)
Table 69.Australia Gas Sensors Market, By Product, 2012-2022 ($Million)
Table 70.Australia Gas Sensors Market, By Technology, 2012-2022 ($Million)
Table 71.Australia Gas Sensors Market, By End User, 2012-2022 ($Million)
Table 72.India Gas Sensors Market, By Product, 2012-2022 ($Million)
Table 73.India Gas Sensors Market, By Technology, 2012-2022 ($Million)
Table 74.India Gas Sensors Market, By End User, 2012-2022 ($Million)
Table 75.South Korea Gas Sensors Market, By Product, 2012-2022 ($Million)
Table 76.South Korea Gas Sensors Market, By Technology, 2012-2022 ($Million)
Table 77.South Korea Gas Sensors Market, By End User, 2012-2022 ($Million)
Table 78.Rest of Asia-Pacific Gas Sensors Market, By Product, 2012-2022 ($Million)
Table 790.Rest of Asia-Pacific Gas Sensors Market, By Technology, 2012-2022 ($Million)
Table 80.Rest of Asia-Pacific Gas Sensors Market, By End User, 2012-2022 ($Million)
Table 81.Rest of the World Gas Sensors Market, By Country, 2012-2022 ($Million)
Table 82.Rest of the World Gas Sensors Market, By Product, 2012-2022 ($Million)
Table 83.Rest of the World Gas Sensors Market, By Technology, 2012-2022 ($Million)
Table 84.Rest of the World Gas Sensors Market, By End User, 2012-2022 ($Million)
Table 85.Brazil Gas Sensors Market, By Product, 2012-2022 ($Million)
Table 86.Brazil Gas Sensors Market, By Technology, 2012-2022 ($Million)
Table 87.Brazil Gas Sensors Market, By End User, 2012-2022 ($Million)
Table 88.Turkey Gas Sensors Market, By Product, 2012-2022 ($Million)
Table 89.Turkey Gas Sensors Market, By Technology, 2012-2022 ($Million)
Table 90.Turkey Gas Sensors Market, By End User, 2012-2022 ($Million)
Table 91.Saudi Arabia Gas Sensors Market, By Product, 2012-2022 ($Million)
Table 92.Saudi Arabia Gas Sensors Market, By Technology, 2012-2022 ($Million)
Table 93.Saudi Arabia Gas Sensors Market, By End User, 2012-2022 ($Million)
Table 94.South Africa Gas Sensors Market, By Product, 2012-2022 ($Million)
Table 95.South Africa Gas Sensors Market, By Technology, 2012-2022 ($Million)
Table 96.South Africa Gas Sensors Market, By End User, 2012-2022 ($Million)
Table 97.United Arab Emirates Gas Sensors Market, By Product, 2012-2022 ($Million)
Table 98.United Arab Emirates Gas Sensors Market, By Technology, 2012-2022 ($Million)
Table 99.United Arab Emirates Gas Sensors Market, By End User, 2012-2022 ($Million)
Table 100.Others Gas Sensors Market, By Product, 2012-2022 ($Million)
Table 101.Others Gas Sensors Market, By Technology, 2012-2022 ($Million)
Table 102.Others Gas Sensors Market, By End User, 2012-2022 ($Million)
Table 103.Aeroqual Ltd.: Key Strategic Developments, 2017-2017
Table 104.ABB Ltd.: Key Strategic Developments, 2017-2017
Table 105.City Technology Ltd.: Key Strategic Developments, 2017-2017
Table 106.Figaro Engineering Inc.: Key Strategic Developments, 2017-2017
Table 107.Dynament Ltd: Key Strategic Developments, 2017-2017
Table 108.Alphanese: Key Strategic Developments, 2017-2017
Table 109.Dragerwerk AG & Co. KGaA: Key Strategic Developments, 2017-2017
Table 110.Membrapor AG: Key Strategic Developments, 2017-2017
Table 111.Robert Bosch, LLC: Key Strategic Developments, 2017-2017
Table 112.Siemens AG: Key Strategic Developments, 2017-2017
Table 113.Yokogawa Electric Corporation: Key Strategic Developments, 2017-2017
Table 114.Trolex Ltd: Key Strategic Developments, 2017-2017
List of Figures
Figure 1.Gas Sensors Market Share, By Product, 2012 & 2022 ($Million)
Figure 2.Gas Sensors Market, By Technology, 2012 & 2022 ($Million)
Figure 3.Gas Sensors Market, By End User, 2012 & 2022 ($Million)
Figure 4.Gas Sensors Market, By Region, 2017, ($Million)
Figure 5.Aeroqual Ltd.: Net Revenues, 2017-2017 ($Million)
Figure 6.Aeroqual Ltd.: Net Revenue Share, By Segment, 2017
Figure 7.Aeroqual Ltd.: Net Revenue Share, By Geography, 2017
Figure 8.City Technology Ltd.: Net Revenues, 2017-2017 ($Million)
Figure 9.City Technology Ltd.: Net Revenue Share, By Segment, 2017
Figure 10.City Technology Ltd.: Net Revenue Share, By Geography, 2017
Figure 11.Figaro Engineering Inc.: Net Revenues, 2017-2017 ($Million)
Figure 12.Figaro Engineering Inc.: Net Revenue Share, By Segment, 2017
Figure 13.Figaro Engineering Inc.: Net Revenue Share, By Geography, 2017
Figure 14.Robert Bosch, LLC: Net Revenues, 2017-2017 ($Million)
Figure 15.Robert Bosch, LLC: Net Revenue Share, By Segment, 2017
Figure 16.Robert Bosch, LLC: Net Revenue Share, By Geography, 2017
Figure 17.Siemens AG: Net Revenues, 2017-2017 ($Million)
Figure 18.Siemens AG: Net Revenue Share, By Segment, 2017
Figure 19.Siemens AG: Net Revenue Share, By Geography, 2017
Research Methodology
We use both primary as well as secondary research for our market surveys, estimates and for developing forecast. Our research process commence by analyzing the problem which enable us to design the scope for our research study. Our research process is uniquely designed with enough flexibility to adjust according to changing nature of products and markets, while retaining core element to ensure reliability and accuracy in research findings. We understand both macro and micro-economic factors to evaluate and forecast different market segments.
Data Mining
Data is extensively collected through various secondary sources such as annual reports, investor presentations, SEC filings, and other corporate publications. We also refer trade magazines, technical journals, paid databases such as Factiva and Bloomberg, industry trade journals, scientific journals, and social media data to understand market dynamics and industry trends. Further, we also conduct primary research to understand market drivers, restraints, opportunities, challenges, and competitive scenario to build our analysis.
Data Collection Matrix
|
Data Collection Matrix |
Supply Side |
Demand Side |
|
Primary Data Sources |
|
|
|
Secondary Data Sources |
|
|
Market Modeling and Forecasting
We use epidemiology and capital equipment-based models to forecast market size of different segments at country and regional level.
- Epidemiology-based Forecasting Model: This method uses epidemiology data gathered through various publications and from physicians to estimate population of patients, flow of treatment of individual disease and therapies. The data collected through this method includes statics on incidence of disease, population suffering from disease, and treatment population. This method is used to understand:
- Number of patients for particular device or medical procedure and
- Repeated use of particular device depending on health and condition of patient
- Capital-based Forecasting Model: This method of forecasting is based on number of replacements, installed-based and new sales of capital equipment used in various healthcare and diagnostic centers. These three parameters are calculated and forecast is developed. Installation base is calculated as average number of units per facility; while sales for particular year is calculated from number of new and replace units. Secondary data is collected through various supply chain intermediaries and opinion leaders to arrive at installation and sales rate. These techniques help our analysts in validating market and developed market estimates and forecast.
We do forecast on basis of several parameters such as market drivers, market opportunities, industry trends government regulations, raw materials supply and trade dynamics to ensure relevance of forecast with market scenario. With increasing need to granulized information, we used bottom-up methodology for forecasting where we evaluate each regional segment differently and combined all forecast to develop final market forecast.
Data Validation
We believe primary research is a very important tool in analyzing and forecasting different markets. In order to make sure accuracy of our findings, our team conducts primary interviews at every stage of research to gain deep insights into current business environment and future trends and key developments in market. This includes use of various methods such as telephonic interviews, focus groups, face to face interviews and questionnaires to validate our research from all aspects. We validate our data through primary research from key industry leaders such as CEO, product managers, marketing managers, suppliers, distributors, and consumers are frequently interviewed. These interviews provide valuable insights which help us to have better market understanding besides validating our estimates and forecast.
Data Triangulation

Industry Analysis
|
Qualitative Data |
Quantitative Data (2017-2025) |
|
|