Epigenetics Market by Product and Research Area - Global Industry Analysis and Forecast to 2027
Published On : August 2017 Pages : 97 Category: Biotechnology Report Code : HC08185
Industry Trend Analysis
The global epigenetics market is expected to be around $1.6 billion by 2027. The market is primarily driven by factors such as increase in research activities related to epigenetics, increasing collaborations between biotechnology companies, pharmaceutical companies and academic as well as research institutions and rising prevalence of cancer around the world. According to the National Cancer Institute under the U.S. Department of Health and Human Services, between 2017 and 2030, new cancer cases around the world are expected to increase by 50% from 14 million to 21 million. As per American Cancer Society’s 2022 report, around 1.7 million new cancer cases will be diagnosed in 2022 in the U.S. With such significant prevalence of cancer, the demand for advanced epigenetics research activities is expected to increase considerably in coming years.
Product Outlook and Trend Analysis
Kits segment held the major share of the global epigenetics market in 2017 owing to their large scale adoption for conducting epigenetics research by research organizations as well as biotechnology and pharmaceutical companies. Different kits used for epigenetics research include RNA sequencing kits, whole-genome amplification kits, bisulfite conversion kits and chip-seq kits among others.
Research Area Outlook and Trend Analysis
Oncology segment held the largest share of the global epigenetics market in 2017 due to increasing demand for cancer research to mitigate the rising incidence of different forms of cancer around the world. However, drug discovery segment is expected to grow with a significant growth rate during the forecast period owing to varied applications of epigenetics in drug development for different diseases such as inflammatory and autoimmune diseases among other types.
Regional Outlook and Trend Analysis
In 2017, North America dominated the global epigenetics market owing to the availability of advanced research infrastructure in the region coupled with increasing funding targeted towards research and development in the field of epigenetics. However, Asia-Pacific epigenetics market is expected to witness fastest growth during the forecast period due to increasing healthcare expenditure and presence of unmet medical needs in emerging countries.
Competitive Outlook and Trend Analysis
The major players operating in the global epigenetics market focus on leveraging technological advancements in epigenetics research to develop improved products which can assist researchers in analyzing different disease etiologies. For instance, in May 2022, Epigentek Group Inc., a New York based biotechnology company, introduced its ELISA kits to be used in circulating histone modifications for colorimetric measurement. The introduction of the new kit was intended towards strengthening the histone modification assays portfolio of the company. Some of the key players operating in the global epigenetics market are, Illumina, Inc., Abcam plc., Thermo Fisher Scientific Inc., Zymo Research Corp, Active Motif Corporation, QIAGEN N.V., New England Biolabs, Inc., Merck KGaA, CellCentric, Eisai Co., Ltd. and Novartis AG.
Market Opportunities
The key opportunity for the players operating in the global epigenetics market lies in development of improved solutions that will assist epigenetic research process for varied applications such as drug development and oncology research. Increasing emphasis on improving the healthcare infrastructure in emerging countries such as China and India will create lucrative growth opportunities for the market in coming years.
Epigenetics Market Segmentation:
By Product:
- Enzymes
- DNA-Modifying Enzymes
- RNA-Modifying Enzymes
- Protein-Modifying Enzymes
- Kits
- Bisulfite Conversion Kits
- RNA Sequencing Kits
- Chip-Seq Kits
- 5-HMC and 5-MC Analysis Kits
- Whole-Genome Amplification Kits
- Other Epigenetics Kits
- Instruments and Consumables
- Next-Generation Sequencers
- Mass Spectrometers
- Sonicators
- QPCR
- Other Epigenetics Instruments and Consumables
- Reagents
- Histones
- Buffers
- Antibodies
- Primers
- Magnetic Beads
- Other Epigenetics Reagents
By Research Area:
- Drug Discovery
- Developmental Biology
- Oncology
- Other Research Areas
By Region:
- North America
- U.S
- Canada
- Mexico
- Europe
- Germany
- France
- UK
- Italy
- Spain
- Rest of Europe
- Asia-Pacific
- Japan
- China
- Australia
- India
- South Korea
- Rest of Asia Pacific
- Rest of the World
- Brazil
- South Africa
- Saudi Arabia
- United Arab Emirates
- Others
Some of the key questions answered by the report are:
- What was the market size in 2017 and forecast from 2022 to 2027?
- What will be the industry market growth from 2022 to 2027?
- What are the major drivers, restraints, opportunities, challenges, and industry trends and their impact on the market forecast?
- What are the major segments leading the market growth and why?
- Which are the leading players in the market and what are the major strategies adopted by them to sustain the market competition?
Market Classification
- Epigenetics Market, By Product, Estimates and Forecast, 2017-2027 ($Million)
- Enzymes
- DNA-Modifying Enzymes
- RNA-Modifying Enzymes
- Protein-Modifying Enzymes
- Kits
- Bisulfite Conversion Kits
- RNA Sequencing Kits
- Chip-Seq Kits
- 5-HMC and 5-MC Analysis Kits
- Whole-Genome Amplification Kits
- Other Epigenetics Kits
- Instruments and Consumables
- Next-Generation Sequencers
- Mass Spectrometers
- Sonicators
- QPCR
- Other Epigenetics Instruments and Consumables
- Reagents
- Histones
- Buffers
- Antibodies
- Primers
- Magnetic Beads
- Other Epigenetics Reagen
- Epigenetics Market, By Research Area, Estimates and Forecast, 2017-2027 ($Million)
- Drug Discovery
- Developmental Biology
- Oncology
- Other Research Areas
- Epigenetics Market, By Region, Estimates and Forecast, 2017-2027 ($Million)
- North America
- North America Epigenetics Market, By Country
- North America Epigenetics Market, By Product
- North America Epigenetics Market, By Research Area
- U.S. Epigenetics Market, By Product
- U.S. Epigenetics Market, By Research Area
- Canada Epigenetics Market, By Product
- Canada Epigenetics Market, By Research Area
- Mexico Epigenetics Market, By Product
- Mexico Epigenetics Market, By Research Area
-
- Europe
- Europe Epigenetics Market, By Country
- Europe Epigenetics Market, By Product
- Europe Epigenetics Market, By Research Area
- Germany Epigenetics Market, By Product
- Germany Epigenetics Market, By Research Area
- France Epigenetics Market, By Product
- France Epigenetics Market, By Research Area
- UK Epigenetics Market, By Product
- UK Epigenetics Market, By Research Area
- Italy Epigenetics Market, By Product
- Italy Epigenetics Market, By Research Area
- Spain Epigenetics Market, By Product
- Spain Epigenetics Market, By Research Area
- Rest of Europe Epigenetics Market, By Product
- Rest of Europe Epigenetics Market, By Research Area
-
- Asia-Pacific
- Asia-Pacific Epigenetics Market, By Country
- Asia-Pacific Epigenetics Market, By Product
- Asia-Pacific Epigenetics Market, By Research Area
- Japan Epigenetics Market, By Product
- Japan Epigenetics Market, By Research Area
- Australia Epigenetics Market, By Product
- Australia Epigenetics Market, By Research Area
- India Epigenetics Market, By Product
- India Epigenetics Market, By Research Area
- South Korea Epigenetics Market, By Product
- South Korea Epigenetics Market, By Research Area
- Rest of Asia-Pacific Epigenetics Market, By Product
- Rest of Asia-Pacific Epigenetics Market, By Research Area
- Asia-Pacific
-
- Rest of the World
- Rest of the World Epigenetics Market, By Country
- Rest of the World Epigenetics Market, By Product
- Rest of the World Epigenetics Market, By Research Area
- Brazil Epigenetics Market, By Product
- Brazil Epigenetics Market, By Research Area
- South Africa Epigenetics Market, By Product
- South Africa Epigenetics Market, By Research Area
- Saudi Arabia Epigenetics Market, By Product
- Saudi Arabia Epigenetics Market, By Research Area
- Turkey Epigenetics Market, By Product
- Turkey Epigenetics Market, By Research Area
- United Arab Emirates Epigenetics Market, By Product
- United Arab Emirates Epigenetics Market, By Research Area
- Others Epigenetics Market, By Product
- Others Epigenetics Market, By Research Area
- Rest of the World
Table of Contents
1. Introduction
1.1. Report Description
1.2. Research Methodology
1.2.1. Secondary Research
1.2.2. Primary Research
2. Executive Summary
2.1. Key Highlights
3. Market Overview
3.1. Introduction
3.1.1. Market Definition
3.1.2. Market Segmentation
3.2. Market Share Analysis
3.3. Market Dynamics
3.3.1. Drivers
3.3.1.1. Increasing Incidence of Cancer Globally
3.3.1.2. Increasing Funding for Epigenetics based Research
3.3.1.3. Increasing Collaboration between Research Institutions, Biotechnology companies and pharmaceutical companies.
3.3.2. Restraints
3.3.2.1. High Cost of Instrumentation
3.3.2.2. Dearth of Skilled Professionals
3.3.3. Opportunities
3.3.3.1. Emerging Markets to Offer Lucrative Growth Opportunities
4. Epigenetics market, By Product
4.1. Introduction
4.2. The Epigenetics market Assessment and Forecast, By Product, 2017-2027
4.3. Enzymes
4.3.1. Market Assessment and Forecast, By Type, 2017-2027 ($Million)
4.3.2. Market Assessment and Forecast, By Region, 2017-2027 ($Million)
4.3.3. DNA-Modifying Enzymes
4.3.3.1. Market Assessment and Forecast, By Region, 2017-2027 ($Million)
4.3.4. RNA-Modifying Enzymes
4.3.4.1. Market Assessment and Forecast, By Region, 2017-2027 ($Million)
4.3.5. Protein-Modifying Enzymes
4.3.5.1. Market Assessment and Forecast, By Region, 2017-2027 ($Million)
4.4. Kits
4.4.1. Market Assessment and Forecast, By Type, 2017-2027 ($Million)
4.4.2. Market Assessment and Forecast, By Region, 2017-2027 ($Million)
4.4.3. Bisulfite Conversion Kits
4.4.3.1. Market Assessment and Forecast, By Region, 2017-2027 ($Million)
4.4.4. Chip-Seq Kits
4.4.4.1. Market Assessment and Forecast, By Region, 2017-2027 ($Million)
4.4.5. 5-HMC and 5-MC Analysis Kits
4.4.5.1. Market Assessment and Forecast, By Region, 2017-2027 ($Million)
4.4.6. Whole-Genome Amplification Kits
4.4.6.1. Market Assessment and Forecast, By Region, 2017-2027 ($Million)
4.4.7. Other Epigenetics Kits
4.4.7.1. Market Assessment and Forecast, By Region, 2017-2027 ($Million)
4.5. Instruments and Consumables
4.5.1. Market Assessment and Forecast, By Type, 2017-2027 ($Million)
4.5.2. Market Assessment and Forecast, By Region, 2017-2027 ($Million)
4.5.3. Next-Generation Sequencers
4.5.3.1. Market Assessment and Forecast, By Region, 2017-2027 ($Million)
4.5.4. Mass Spectrometers
4.5.4.1. Market Assessment and Forecast, By Region, 2017-2027 ($Million)
4.5.5. Sonicators
4.5.5.1. Market Assessment and Forecast, By Region, 2017-2027 ($Million)
4.5.6. QPCR
4.5.6.1. Market Assessment and Forecast, By Region, 2017-2027 ($Million)
4.5.7. Other Epigenetics Instruments and Consumables
4.5.7.1. Market Assessment and Forecast, By Region, 2017-2027 ($Million)
4.6. Reagents
4.6.1. Market Assessment and Forecast, By Type, 2017-2027 ($Million)
4.6.2. Market Assessment and Forecast, By Region, 2017-2027 ($Million)
4.6.3. Histones
4.6.3.1. Market Assessment and Forecast, By Region, 2017-2027 ($Million)
4.6.4. Buffers
4.6.4.1. Market Assessment and Forecast, By Region, 2017-2027 ($Million)
4.6.5. Antibodies
4.6.5.1. Market Assessment and Forecast, By Region, 2017-2027 ($Million)
4.6.6. Primers
4.6.6.1. Market Assessment and Forecast, By Region, 2017-2027 ($Million)
4.6.7. Magnetic Beads
4.6.7.1. Market Assessment and Forecast, By Region, 2017-2027 ($Million)
4.6.8. Other Epigenetics Reagents
4.6.8.1. Market Assessment and Forecast, By Region, 2017-2027 ($Million)
5. Epigenetics Market, By Research Area
5.1. Introduction
5.2. Epigenetics Market Assessment and Forecast, By Research Area, 2017-2027
5.3. Drug Discovery
5.3.1. Market Assessment and Forecast, By Region, 2017-2027 ($Million)
5.4. Developmental Biology
5.4.1. Market Assessment and Forecast, By Region, 2017-2027 ($Million)
5.5. Oncology
5.5.1. Market Assessment and Forecast, By Region, 2017-2027 ($Million)
5.6. Other Research Areas
5.6.1. Market Assessment and Forecast, By Region, 2017-2027 ($Million)
6. Epigenetics Market, By Region
6.1. Introduction
6.2. Epigenetics Market Assessment and Forecast, By Region, 2017-2027 ($Million)
6.3. North America
6.3.1. Market Assessment and Forecast, By Country, 2017-2027 ($Million)
6.3.2. Market Assessment and Forecast, By Product, 2017-2027 ($Million)
6.3.3. Market Assessment and Forecast, By Research Area, 2017-2027 ($Million)
6.3.3.1. U.S.
6.3.3.1.1. Market Assessment and Forecast, By Product, 2017-2027 ($Million)
6.3.3.1.2. Market Assessment and Forecast, By Research Area, 2017-2027 ($Million)
6.3.3.2. Canada
6.3.3.2.1. Market Assessment and Forecast, By Product, 2017-2027 ($Million)
6.3.3.2.2. Market Assessment and Forecast, By Research Area, 2017-2027 ($Million)
6.3.3.3. Mexico
6.3.3.3.1. Market Assessment and Forecast, By Product, 2017-2027 ($Million)
6.3.3.3.2. Market Assessment and Forecast, By Research Area, 2017-2027 ($Million)
6.4. Europe
6.4.1. Market Assessment and Forecast, By Country, 2017-2027 ($Million)
6.4.2. Market Assessment and Forecast, By Product, 2017-2027 ($Million)
6.4.3. Market Assessment and Forecast, By Research Area, 2017-2027 ($Million)
6.4.3.1. Germany
6.4.3.1.1. Market Assessment and Forecast, By Product, 2017-2027 ($Million)
6.4.3.1.2. Market Assessment and Forecast, By Research Area, 2017-2027 ($Million)
6.4.3.2. France
6.4.3.2.1. Market Assessment and Forecast, By Product, 2017-2027 ($Million)
6.4.3.2.2. Market Assessment and Forecast, By Product, 2017-2027 ($Million)
6.4.3.3. UK
6.4.3.3.1. Market Assessment and Forecast, By Product, 2017-2027 ($Million)
6.4.3.3.2. Market Assessment and Forecast, By Research Area, 2017-2027 ($Million)
6.4.3.4. Italy
6.4.3.4.1. Market Assessment and Forecast, By Product, 2017-2027 ($Million)
6.4.3.4.2. Market Assessment and Forecast, By Research Area, 2017-2027 ($Million)
6.4.3.5. Spain
6.4.3.5.1. Market Assessment and Forecast, By Product, 2017-2027 ($Million)
6.4.3.5.2. Market Assessment and Forecast, By Research Area, 2017-2027 ($Million)
6.4.3.6. Russia
6.4.3.6.1. Market Assessment and Forecast, By Product, 2017-2027 ($Million)
6.4.3.6.2. Market Assessment and Forecast, By Research Area, 2017-2027 ($Million)
6.4.3.7. Rest of Europe
6.4.3.7.1. Market Assessment and Forecast, By Product, 2017-2027 ($Million)
6.4.3.7.2. Market Assessment and Forecast, By Research Area, 2017-2027 ($Million)
6.5. Asia-Pacific
6.5.1. Market Assessment and Forecast, By Country, 2017-2027 ($Million)
6.5.2. Market Assessment and Forecast, By Product, 2017-2027 ($Million)
6.5.3. Market Assessment and Forecast, By Research Area, 2017-2027 ($Million)
6.5.3.1. Japan
6.5.3.1.1. Market Assessment and Forecast, By Product, 2017-2027 ($Million)
6.5.3.1.2. Market Assessment and Forecast, By Research Area, 2017-2027 ($Million)
6.5.3.2. China
6.5.3.2.1. Market Assessment and Forecast, By Product, 2017-2027 ($Million)
6.5.3.2.2. Market Assessment and Forecast, By Research Area, 2017-2027 ($Million)
6.5.3.3. Australia
6.5.3.3.1. Market Assessment and Forecast, By Product, 2017-2027 ($Million)
6.5.3.3.2. Market Assessment and Forecast, By Research Area, 2017-2027 ($Million)
6.5.3.4. India
6.5.3.4.1. Market Assessment and Forecast, By Product, 2017-2027 ($Million)
6.5.3.4.2. Market Assessment and Forecast, By Research Area, 2017-2027 ($Million)
6.5.3.5. South Korea
6.5.3.5.1. Market Assessment and Forecast, By Product, 2017-2027 ($Million)
6.5.3.5.2. Market Assessment and Forecast, By Research Area, 2017-2027 ($Million)
6.5.3.6. Taiwan
6.5.3.6.1. Market Assessment and Forecast, By Product, 2017-2027 ($Million)
6.5.3.6.2. Market Assessment and Forecast, By Research Area, 2017-2027 ($Million)
6.5.3.7. Rest of Asia-Pacific
6.5.3.7.1. Market Assessment and Forecast, By Product, 2017-2027 ($Million)
6.5.3.7.2. Market Assessment and Forecast, By Research Area, 2017-2027 ($Million)
6.6. Rest of the World
6.6.1. Market Assessment and Forecast, By Country, 2017-2027 ($Million)
6.6.2. Market Assessment and Forecast, By Product, 2017-2027 ($Million)
6.6.3. Market Assessment and Forecast, By Research Area, 2017-2027 ($Million)
6.6.3.1. Brazil
6.6.3.1.1. Market Assessment and Forecast, By Product, 2017-2027 ($Million)
6.6.3.1.2. Market Assessment and Forecast, By Research Area, 2017-2027 ($Million)
6.6.3.2. Turkey
6.6.3.2.1. Market Assessment and Forecast, By Product, 2017-2027 ($Million)
6.6.3.2.2. Market Assessment and Forecast, By Research Area, 2017-2027 ($Million)
6.6.3.3. Saudi Arabia
6.6.3.3.1. Market Assessment and Forecast, By Product, 2017-2027 ($Million)
6.6.3.3.2. Market Assessment and Forecast, By Research Area, 2017-2027 ($Million)
6.6.3.4. South Africa
6.6.3.4.1. Market Assessment and Forecast, By Product, 2017-2027 ($Million)
6.6.3.4.2. Market Assessment and Forecast, By Research Area, 2017-2027 ($Million)
6.6.3.5. United Arab Emirates
6.6.3.5.1. Market Assessment and Forecast, By Product, 2017-2027 ($Million)
6.6.3.5.2. Market Assessment and Forecast, By Research Area, 2017-2027 ($Million)
6.6.3.6. Others
6.6.3.6.1. Market Assessment and Forecast, By Product, 2017-2027 ($Million)
6.6.3.6.2. Market Assessment and Forecast, By Research Area, 2017-2027 ($Million)
7. Company Profiles
7.1. Illumina, Inc.
7.1.1. Business Overview
7.1.2. Product Portfolio
7.1.3. Key Financials
7.1.4. Strategic Developments
7.2. Abcam plc
7.2.1. Business Overview
7.2.2. Product Portfolio
7.2.3. Key Financials
7.2.4. Strategic Developments
7.3. Thermo Fisher Scientific Inc.
7.3.1. Business Overview
7.3.2. Product Portfolio
7.3.3. Key Financials
7.3.4. Strategic Developments
7.4. Diagenode S.A.
7.4.1. Business Overview
7.4.2. Product Portfolio
7.4.3. Strategic Developments
7.5. Zymo Research Corp
7.5.1. Business Overview
7.5.2. Product Portfolio
7.5.3. Strategic Developments
7.6. Active Motif Corporation
7.6.1. Business Overview
7.6.2. Product Portfolio
7.6.3. Strategic Developments
7.7. QIAGEN N.V.
7.7.1. Business Overview
7.7.2. Product Portfolio
7.7.3. Key Financials
7.7.4. Strategic Developments
7.8. New England Biolabs, Inc.
7.8.1. Business Overview
7.8.2. Product Portfolio
7.8.3. Strategic Developments
7.9. Merck KGaA
7.9.1. Business Overview
7.9.2. Product Portfolio
7.9.3. Key Financials
7.9.4. Strategic Developments
7.10. Eisai Co., Ltd.
7.10.1. Business Overview
7.10.2. Product Portfolio
7.10.3. Key Financials
7.10.4. Strategic Developments
7.11. Novartis AG
7.11.1. Business Overview
7.11.2. Product Portfolio
7.11.3. Key Financials
7.11.4. Strategic Developments
List of Tables
Table 1.Epigenetics Market, By Product, 2017-2025 ($Million)
Table 2.Enzymes Market, By Type ($Million), 2017-2025 ($Million)
Table 3.Enzymes Market, By Region ($Million), 2017-2025 ($Million)
Table 4.DNA-Modifying Enzymes Market, By Region ($Million), 2017-2025 ($Million)
Table 5.RNA-Modifying Enzymes Market, By Region ($Million), 2017-2025 ($Million)
Table 6.Protein-Modifying Enzymes Market, By Region, 2017-2025 ($Million)
Table 7.Kits Market, By Type ($Million), 2017-2025 ($Million)
Table 8.Kits Market, By Region ($Million), 2017-2025 ($Million)
Table 9.Bisulfite Conversion Kits Market, By Region ($Million), 2017-2025 ($Million)
Table 10.RNA Sequencing Kits Market, By Region ($Million), 2017-2025 ($Million)
Table 11.Chip-Seq Kits Market, By Region ($Million), 2017-2025 ($Million)
Table 12.5-HMC and 5-MC Analysis Kits Market, By Region ($Million), 2017-2025 ($Million)
Table 13.Whole-Genome Amplification Kits Market, By Region ($Million), 2017-2025 ($Million)
Table 14.Other Epigenetics Kits Market, By Region ($Million), 2017-2025 ($Million)
Table 15.Instruments and Consumables Market, By Type ($Million), 2017-2025 ($Million)
Table 16.Instruments and Consumables Market, By Region ($Million), 2017-2025 ($Million)
Table 17.Next-Generation Sequencers Market, By Region ($Million), 2017-2025 ($Million)
Table 18.Mass Spectrometers Market, By Region ($Million), 2017-2025 ($Million)
Table 19.Sonicators Market, By Region ($Million), 2017-2025 ($Million)
Table 20.QPCR Market, By Region ($Million), 2017-2025 ($Million)
Table 21.Other Epigenetics Instruments and Consumables Market, By Region ($Million), 2017-2025 ($Million)
Table 22.Reagents Market, By Type ($Million), 2017-2025 ($Million)
Table 23.Reagents Market, By Region ($Million), 2017-2025 ($Million)
Table 24.Histones Market, By Region ($Million), 2017-2025 ($Million)
Table 25.Buffers Market, By Region ($Million), 2017-2025 ($Million)
Table 26.Antibodies Market, By Region ($Million), 2017-2025 ($Million)
Table 27.Primers Market, By Region ($Million), 2017-2025 ($Million)
Table 28.Magnetic Beads Market, By Region ($Million), 2017-2025 ($Million)
Table 29.Other Epigenetics Reagents Market, By Region ($Million), 2017-2025 ($Million)
Table 30.Epigenetics Market, By Research Area, 2017-2025 ($Million)
Table 31.Drug Discovery Market, By Region, 2017-2025 ($Million)
Table 32.Developmental Biology Market, By Region, 2017-2025 ($Million)
Table 33.Oncology Market, By Region, 2017-2025 ($Million)
Table 34.Other Research Areas Market, By Region, 2017-2025, ($Million)
Table 35.Epigenetics Market, By Region, 2017-2025 ($Million)
Table 36.North America Epigenetics Market, By Country, 2017-2025 ($Million)
Table 37.North America Epigenetics Market, By Product, 2017-2025 ($Million)
Table 38.North America Epigenetics Market, By Research Area, 2017-2025 ($Million)
Table 39.U.S. Epigenetics Market, by Product, 2017-2025 ($Million)
Table 40.U.S. Epigenetics Market, by Research Area, 2017-2025 ($Million)
Table 41.Canada Epigenetics Market, By Product, 2017-2025 ($Million)
Table 42.Canada Epigenetics Market, By Research Area, 2017-2025 ($Million)
Table 43.Mexico Epigenetics Market, By Product, 2017-2025 ($Million)
Table 44.Mexico Epigenetics Market, By Research Area, 2017-2025 ($Million)
Table 45.Europe Epigenetics Market, By Country, 2017-2025 ($Million)
Table 46.Europe Epigenetics Market, By Product, 2017-2025 ($Million)
Table 47.Europe Epigenetics Market, By Research Area, 2017-2025 ($Million)
Table 48.Germany Epigenetics Market, By Product, 2017-2025 ($Million)
Table 49.Germany Epigenetics Market, By Research Area, 2017-2025 ($Million)
Table 50.France Epigenetics Market, By Product, 2017-2025 ($Million)
Table 51.France Epigenetics Market, By Research Area, 2017-2025 ($Million)
Table 52.UK Epigenetics Market, By Product, 2017-2025 ($Million)
Table 53.UK Epigenetics Market, By Research Area, 2017-2025 ($Million)
Table 54.Italy Epigenetics Market, By Product, 2017-2025 ($Million)
Table 55.Italy Epigenetics Market, By Research Area, 2017-2025 ($Million)
Table 56.Spain Epigenetics Market, By Product, 2017-2025 ($Million)
Table 57.Spain Epigenetics Market, By Research Area, 2017-2025 ($Million)
Table 58.Russia Epigenetics Market, By Product, 2017-2025 ($Million)
Table 60.Russia Epigenetics Market, By Research Area, 2017-2025 ($Million)
Table 61.Rest of Europe Epigenetics Market, By Product, 2017-2025 ($Million)
Table 62.Rest of Europe Epigenetics Market, By Research Area, 2017-2025 ($Million)
Table 63.Asia-Pacific Epigenetics Market, By Country, 2017-2025 ($Million)
Table 64.Asia-Pacific Epigenetics Market, By Product, 2017-2025 ($Million)
Table 65.Asia-Pacific Epigenetics Market, By Research Area, 2017-2025 ($Million)
Table 66.Japan Epigenetics Market, By Product, 2017-2025 ($Million)
Table 67.Japan Epigenetics Market, By Research Area, 2017-2025 ($Million)
Table 68.China Epigenetics Market, By Product, 2017-2025 ($Million)
Table 69.China Epigenetics Market, By Research Area, 2017-2025 ($Million)
Table 70.Australia Epigenetics Market, By Product, 2017-2025 ($Million)
Table 71.Australia Epigenetics Market, By Research Area, 2017-2025 ($Million)
Table 72.India Epigenetics Market, By Product, 2017-2025 ($Million)
Table 73.India Epigenetics Market, By Research Area, 2017-2025 ($Million)
Table 74.South Korea Epigenetics Market, By Product, 2017-2025 ($Million)
Table 75.South Korea Epigenetics Market, By Research Area, 2017-2025 ($Million)
Table 76.Taiwan Epigenetics Market, By Product, 2017-2025 ($Million)
Table 77.Taiwan Epigenetics Market, By Research Area, 2017-2025 ($Million)
Table 78.Rest of Asia-Pacific Epigenetics Market, By Product, 2017-2025 ($Million)
Table 79.Rest of Asia-Pacific Epigenetics Market, By Research Area, 2017-2025 ($Million)
Table 80.Rest of the World Epigenetics Market, By Country, 2017-2025 ($Million)
Table 81.Rest of the World Epigenetics Market, By Product, 2017-2025 ($Million)
Table 82.Rest of the World Epigenetics Market, By Research Area, 2017-2025 ($Million)
Table 83.Brazil Epigenetics Market, By Product, 2017-2025 ($Million)
Table 84.Brazil Epigenetics Market, By Research Area, 2017-2025 ($Million)
Table 85.Turkey Epigenetics Market, By Product, 2017-2025 ($Million)
Table 86.Turkey Epigenetics Market, By Research Area, 2017-2025 ($Million)
Table 87.Saudi Arabia Epigenetics Market, By Product, 2017-2025 ($Million)
Table 88.Saudi Arabia Epigenetics Market, By Research Area, 2017-2025 ($Million)
Table 89.South Africa Epigenetics Market, By Product, 2017-2025 ($Million)
Table 90.South Africa Epigenetics Market, By Research Area, 2017-2025 ($Million)
Table 91.United Arab Emirates Epigenetics Market, By Product, 2017-2025 ($Million)
Table 92.United Arab Emirates Epigenetics Market, By Research Area, 2017-2025 ($Million)
Table 93.Others Epigenetics Market, By Product, 2017-2025 ($Million)
Table 94.Others Epigenetics Market, By Research Area, 2017-2025 ($Million)
Table 95.Illumina, Inc.: Key Strategic Developments, 2017-2017
Table 96.Abcam plc: Key Strategic Developments, 2017-2017
Table 97.Thermo Fisher Scientific Inc.: Key Strategic Developments, 2017-2017
Table 98.Diagenode S.A.: Key Strategic Developments, 2017-2017
Table 99.Zymo Research Corp: Key Strategic Developments, 2017-2017
Table 100.Active Motif Corporation: Key Strategic Developments, 2017-2017
Table 101.QIAGEN N.V.: (GlobalMed): Key Strategic Developments, 2017-2017
Table 102.New England Biolabs, Inc.: Key Strategic Developments, 2017-2017
Table 103.Merck KGaA: Key Strategic Developments, 2017-2017
Table 104.Eisai Co., Ltd.: Key Strategic Developments, 2017-2017
Table 105.Novartis AG: Key Strategic Developments, 2017-2017
List of Figures
Figure 1.Epigenetics Market Share, By Product, 2017 & 2025 ($Million)
Figure 2.Epigenetics Market, By Research Area, 2017 & 2025, ($Million)
Figure 3.Epigenetics Market, By Region, 2017 & 2025, ($Million)
Figure 4.Illumina, Inc.: Net Revenues, 2017-2017 ($Million)
Figure 5.Illumina, Inc.: Net Revenue Share, By Segment, 2017
Figure 6.Illumina, Inc.: Net Revenue Share, By Geography, 2017
Figure 7.Abcam plc: Net Revenues, 2017-2017 ($Million)
Figure 8.Abcam plc: Net Revenue Share, By Segment, 2017
Figure 9.Abcam plc: Net Revenue Share, By Geography, 2017
Figure 10.Thermo Fisher Scientific Inc.: Net Revenues, 2017-2017 ($Million)
Figure 11.Thermo Fisher Scientific Inc.: Net Revenue Share, By Segment, 2017
Figure 12.Thermo Fisher Scientific Inc.: Net Revenue Share, By Geography, 2017
Figure 13.QIAGEN N.V.: Net Revenues, 2017-2017 ($Million)
Figure 14.QIAGEN N.V.: Net Revenue Share, By Segment, 2017
Figure 15.QIAGEN N.V.: Net Revenue Share, By Geography, 2017
Figure 16.Merck KGaA: Net Revenues, 2017-2017 ($Million)
Figure 17.Merck KGaA: Net Revenue Share, By Segment, 2017
Figure 18.Merck KGaA: Net Revenue Share, By Geography, 2017
Figure 16.Eisai Co., Ltd.: Net Revenues, 2017-2017 ($Million)
Figure 17.Eisai Co., Ltd.: Net Revenue Share, By Segment, 2017
Figure 18.Eisai Co., Ltd.: Net Revenue Share, By Geography, 2017
Figure 16.Novartis AG: Net Revenues, 2017-2017 ($Million)
Figure 17.Novartis AG: Net Revenue Share, By Segment, 2017
Figure 18.Novartis AG: Net Revenue Share, By Geography, 2017
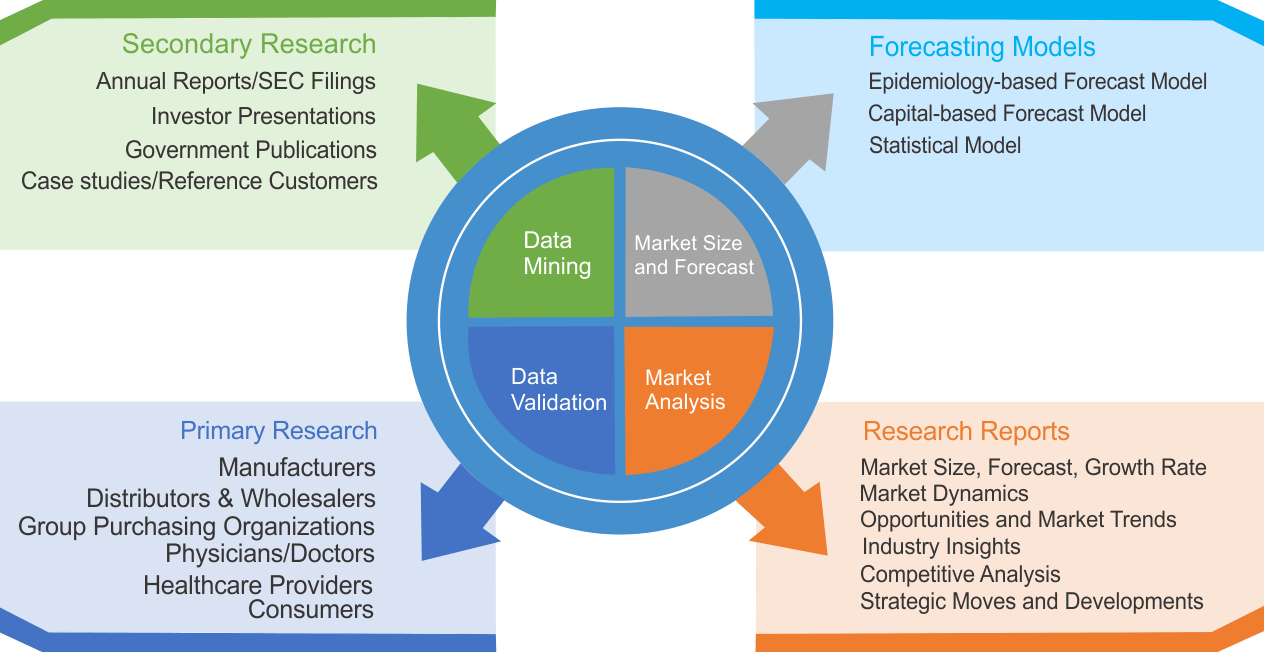
Research Methodology
We use both primary as well as secondary research for our market surveys, estimates and for developing forecast. Our research process commence by analyzing the problem which enable us to design the scope for our research study. Our research process is uniquely designed with enough flexibility to adjust according to changing nature of products and markets, while retaining core element to ensure reliability and accuracy in research findings. We understand both macro and micro-economic factors to evaluate and forecast different market segments.
Data Mining
Data is extensively collected through various secondary sources such as annual reports, investor presentations, SEC filings, and other corporate publications. We also refer trade magazines, technical journals, paid databases such as Factiva and Bloomberg, industry trade journals, scientific journals, and social media data to understand market dynamics and industry trends. Further, we also conduct primary research to understand market drivers, restraints, opportunities, challenges, and competitive scenario to build our analysis.
Data Collection Matrix
|
Data Collection Matrix |
Supply Side |
Demand Side |
|
Primary Data Sources |
|
|
|
Secondary Data Sources |
|
|
Market Modeling and Forecasting
We use epidemiology and capital equipment-based models to forecast market size of different segments at country and regional level.
- Epidemiology-based Forecasting Model: This method uses epidemiology data gathered through various publications and from physicians to estimate population of patients, flow of treatment of individual disease and therapies. The data collected through this method includes statics on incidence of disease, population suffering from disease, and treatment population. This method is used to understand:
- Number of patients for particular device or medical procedure and
- Repeated use of particular device depending on health and condition of patient
- Capital-based Forecasting Model: This method of forecasting is based on number of replacements, installed-based and new sales of capital equipment used in various healthcare and diagnostic centers. These three parameters are calculated and forecast is developed. Installation base is calculated as average number of units per facility; while sales for particular year is calculated from number of new and replace units. Secondary data is collected through various supply chain intermediaries and opinion leaders to arrive at installation and sales rate. These techniques help our analysts in validating market and developed market estimates and forecast.
We do forecast on basis of several parameters such as market drivers, market opportunities, industry trends government regulations, raw materials supply and trade dynamics to ensure relevance of forecast with market scenario. With increasing need to granulized information, we used bottom-up methodology for forecasting where we evaluate each regional segment differently and combined all forecast to develop final market forecast.
Data Validation
We believe primary research is a very important tool in analyzing and forecasting different markets. In order to make sure accuracy of our findings, our team conducts primary interviews at every stage of research to gain deep insights into current business environment and future trends and key developments in market. This includes use of various methods such as telephonic interviews, focus groups, face to face interviews and questionnaires to validate our research from all aspects. We validate our data through primary research from key industry leaders such as CEO, product managers, marketing managers, suppliers, distributors, and consumers are frequently interviewed. These interviews provide valuable insights which help us to have better market understanding besides validating our estimates and forecast.
Data Triangulation
Industry Analysis
|
Qualitative Data |
Quantitative Data (2017-2025) |
|
|