Digital Signage Market by Type, Component, Technology, Application and Location - Global Industry Analysis and Forecast to 2022
Published On : October 2017 Pages : 95 Category: Lighting & Display Technologies Report Code : SE10292
Industry Trend Analysis
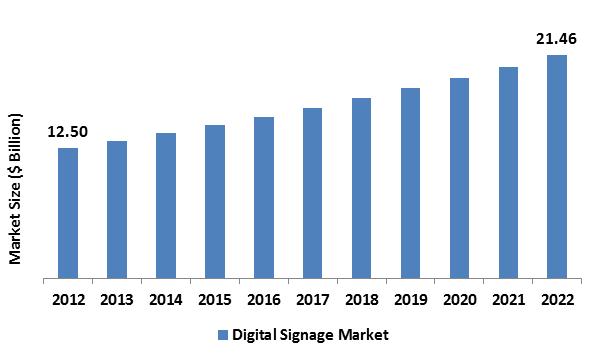
In 2017, the global digital signage market was valued around USD 12.50 billion and is anticipated to reach approximately USD 21.46 billion while maintaining a compound annual growth rate (CAGR) of 4.98% during the forecast period owing to rising demand for the digital advertising of services and products in order to draw the target audience’s attention in an useful manner. The development of innovative products like leak detector systems, home monitoring systems, etc. together with complex monetary products like forex cards that require succinct and informative advertisement matter are few of the driving factors that are expected to fuel the digital signage demand. Additionally, there is an increasing demand for implementing superior products that need digitized information guidance and management which can be accessed from distant locations. This is among the major drivers projected to drive the global market during the forecast years. Digital signage presents the essential quality information to a huge amount of viewers by using big display screens around the location with a focused target audience. Eventually, the rising awareness amongst the consumers about the complexity and drawbacks of conventional advertising like short-lived print marketing is prompting the adoption of digitized advertisement. Moreover, the novel efforts contributed by the researchers, display designers, and promotion agencies are spending extra on the development of the display technology of digital signage. So, all these factors are consecutively anticipated to boost the growth of the global market. With the evolution of LED, OLED, LCD, and Super AMOLED as well as the innovations in display technologies, is fortifying market growth further. These technologies have contributed to the improvement of the advertisement content quality, hence impacting the target audience positively. The implementation of these sophisticated technologies by digital poster suppliers in display systems is estimated to fuel the global market growth. Though, the factors like hardware and software compatibility, electrical interface, connectivity, and networking are some general issues expected to hamper the smooth growth of the market.
Type Outlook and Trend Analysis
According to types, the industry has been divided into video screens, kiosks, video walls, digital posters, transparent LED screens, and others. In 2017, the video walls section reported for the major market share and this is estimated to persist during the forecast years. The kiosks and video screens section acquired an elevated industry share accompanied by the video walls section in 2017. The utilization of these kinds of digital posters is better than the other types due to the factors like ease of installation & mounting, connectivity, and low price. Video screens and walls have seized a key market share over public places such as shopping malls and other. Kiosks are normally used to render information and for promoting in retail verticals and institutes. Though, transparent LED screens are forecasted to experience the maximum growth rate during the approaching years. Transparent LED screens are skilled for presenting a clearness level further than 80% along with the high resolution. Furthermore, they are sufficiently proficient concerning energy, hence, contracting consumption of energy and optimizing the fixed cost spending of users. All these factors are expected to boost the transparent LED screens demand during the forecast years.
Component Outlook and Trend Analysis
According to components, the market has been divided into software, hardware, and services sectors. In 2017, the hardware components section ruled the global market and is expected to retain its position during the projected period. The hardware requirement is massive as compared to software, and hence, the sector reports for a huge industry share. Accompanied by the hardware components section, the software section reported for a significant industry share. The software section is forecasted to demonstrate a stable growth during the forecast years. The services section registers a relatively lesser demand due to fewer service and maintenance issues taking place in digital signages. The internet connectivity and installation of a digital display are the key services concerned here. Thus, the service benefits are pretty cheaper than the software and hardware demands, contributing to a smaller industry share.
Application Outlook and Trend Analysis
According to applications, the global market is classified into corporate, retail, banking, education, transportation, and healthcare sectors. In 2017, the retail sector reported for the highest market share. The retail section is the most important sector requiring digital advertisements so as to promote and market services and products. The rivalry between the retail merchants due to the range of product benefits in the market has contributed to the increasing awareness levels regarding efficient marketing strategies. Hence, digital posters are used widely by the retailers since digitized advertising is an efficient approach to promoting a product, which draws the consumers’ attention. Further, the banking segment is another important use of this technology. This is assigned to the wide existence of ATMs, banks, and other bank-related facilities like e-banking centers. This sector is expected to show growth at a stable pace and must keep on bestowing constantly to the global market share. The transportation segment involves the application of digital posters & promotions at railway stations, airports, bus stands, and metro stations. Due to rising improvement in the transportation sector and the increasing urbanization in developing nations, the advertisement market is anticipated to expand, eventually boosting the growth of the global market.
Location Outlook and Trend Analysis
By location, the global market is segmented into out-store locations and in-stores locations. In-store locations involve the installation of digital posters inside closed places like banks, corporate offices, malls, healthcare centers, and retail shops. In 2017, In-store location reported for the major industry share. This is assigned to the massive demand from retail shops as the retail segment is the most assuring application of digital displays section for advertisement. The sector is forecasted to retain its spot in the global industry during the projected period and demonstrate growth at a significant pace owing to steady demand. Though, the requirement for out-store locations is projected to show extensive growth during the forecast years. Hence, the section is forecasted to contribute considerably to the global digital signage industry. The requirement at out-store locations is estimated to rise due to the emerging transportation segment in developing nations. In addition, the growing demand for advertising products efficiently and on a comprehensive together with new trends like introductory offers on products & services, election campaigns, and the escalating quantity of live shows & concerts are prone to boost the use of digital posters in open place.
Technology Outlook and Trend Analysis
The market has been segmented according to the technologies into the projection, LCD, and LED. LCD technology is among the most widely implemented technologies in the marketing & advertisement market. Thus, in 2017, it reported for the major market share. The easiness of manufacturing LCDs and their lesser production costs are some factors behind the widespread implementation of LCD technology in digitalized posters. Though, LEDs have made a mark as a normal product successfully with their high-quality display. Producers remain hopeful of the designing of larger, flat-paneled, slimmer, and brighter displays. LEDs are among the successful accomplishments in display technology. Further innovations in LEDs have contributed to the development of OLED displays which are projected to drive the global adoption of LED displays. Better picture quality presented by the OLED is expected to be an important driving factor for the growing demand. Though, the manufacturing costs and complex manufacturing method, along with a smaller lifespan of LED displays might hinder the growth of the global market. Projection display might be a front projection or rear projection. Projection display technology is estimated to demonstrate steady adoption and develop at a stable rate during the forecast years. The fact that the technology is slightly complicated in nature and hard to install, makes it less adaptive. Hence, the industry share for projection technology is relatively less, while the projection technology demand is rising and is anticipated to develop at a significant pace.
Regional Outlook and Trend Analysis
Europe and North America are jointly anticipated to lead during the forecast years owing to the rising presence of committed providers of industrial products and equipment. Additionally, the digitized display demand in the retail market is rising at a significant rate in these areas, which is driving the growth of global industry further. Countries like Germany, United Kingdom, and the United States are anticipated to demonstrate major growth, mainly due to growing R&D efforts contributed by manufacturers in an attempt to improve the advertising content quality. Moreover, augmented governmental initiatives to install digital signage in offices in order to retain constant information stream is yet again expected to propel the growth of the region. Though, the Asia-Pacific regional market is projected to conquest the European regional market by 2022. This expansion of the European market is assigned to the rising awareness levels amongst the regional population concerning digital signage benefits. India, South Korea, and China are predicted to show significant growth, mostly owing to the rising applications over offices, hospitality industry, hospitals, banks, and the retail stores. Also, the growing transportation segment in the Asia-Pacific regional market is expected to drive the market growth further. The increasing disposable earnings of the region’s population have contributed to a rise in a number of visitors to multiplexes and malls in the developing economies of Asia-Pacific region. Hence, market players are leveraging these opportunities with the intention of promoting their product benefits by utilizing of big displays, sequentially helping them to draw the objective audience in an efficient way.
Competitive Outlook and Trend Analysis
The major market participants in the global digital signage market are Microsoft Corporation, Omnivex Corporation, KeyWest Technology, Inc., NEC Display Solutions, Ltd., ADFlow Networks, Winmate Communication, Inc., LG Electronics, Samsung Electronics, and Panasonic Corporation. The advent of novel solutions is expected to drive the market during the forecast years. For example, Intel Corporation brought in Open Pluggable Specification (OPS) that has assisted in standardizing the digitized marketing plan. In addition, Japan’s Nippon Telegraph and Telephone (NTT) Corporation, produced digital signs with the help of aroma-emitting devices. The market players, by continuous innovation and R&D efforts, are also striving to formulate high-value and premium quality products at best possible cost to achieve a competitive benefit in the price-sensitive industry.
The global digital signage market is segmented as follows
By Type
- Video Walls
- Transparent LED Screens
- Video Screens
- Kiosks
- Digital Posters
- Other Signage Types
By Component
- Software
- Hardware
- Services
By Technology
- Projection
- LED
- LCD
By Application
- Corporate
- Retail
- Transportation
- Banking
- Education
- Healthcare
By Location
- Out-store
- In-store
By Region
- North America
- U.S
- Canada
- Mexico
- Europe
- Germany
- France
- UK
- Italy
- Spain
- Rest of Europe
- Asia-Pacific
- Japan
- China
- Australia
- India
- South Korea
- Rest of Asia Pacific
- Rest of the World
- Brazil
- South Africa
- Saudi Arabia
- United Arab Emirates
- Others
Some of the key questions answered by the report are:
- What was the market size in 2017 and forecast from 2017 to 2022?
- What will be the industry market growth from 2017 to 2022?
- What are the major drivers, restraints, opportunities, challenges, and industry trends and their impact on the market forecast?
- What are the major segments leading the market growth and why?
- Which are the leading players in the market and what are the major strategies adopted by them to sustain the market competition?
Market Classification
- Digital Signage Market, By Type, Estimates and Forecast, 2012-2022 ($Million)
- Video Walls
- Transparent LED Screens
- Video Screens
- Kiosks
- Digital Posters
- Other Signage Types
- Digital Signage Market, By Component, Estimates and Forecast, 2012-2022 ($Million)
- Software
- Hardware
- Services
- Digital Signage Market, By Technology, Estimates and Forecast, 2012-2022 ($Million)
- Projection
- LED
- LCD
- Digital Signage Market, By Application, Estimates and Forecast, 2012-2022 ($Million)
- Corporate
- Retail
- Transportation
- Banking
- Education
- Healthcare
- Digital Signage Market, By Location, Estimates and Forecast, 2012-2022 ($Million)
- Out-store
- In-store
- Digital Signage Market, By Region, Estimates and Forecast, 2012-2022 ($Million)
- North America
- North America Digital Signage Market, By Country
- North America Digital Signage Market, By Type
- North America Digital Signage Market, By Component
- North America Digital Signage Market, By Technology
- North America Digital Signage Market, By Application
- North America Digital Signage Market, By Location
- U.S. Digital Signage Market, By Type
- U.S. Digital Signage Market, By Component
- U.S. Digital Signage Market, By Technology
- U.S. Digital Signage Market, By Application
- U.S. Digital Signage Market, By Location
- Canada Digital Signage Market, By Type
- Canada Digital Signage Market, By Component
- Canada Digital Signage Market, By Technology
- Canada Digital Signage Market, By Application
- Canada Digital Signage Market, By Location
- Mexico Digital Signage Market, By Type
- Mexico Digital Signage Market, By Component
- Mexico Digital Signage Market, By Technology
- Mexico Digital Signage Market, By Application
- Mexico Digital Signage Market, By Location
-
- Europe
- Europe Digital Signage Market, By Country
- Europe Digital Signage Market, By Type
- Europe Digital Signage Market, By Component
- Europe Digital Signage Market, By Technology
- Europe Digital Signage Market, By Application
- Europe Digital Signage Market, By Location
- Germany Digital Signage Market, By Type
- Germany Digital Signage Market, By Component
- Germany Digital Signage Market, By Technology
- Germany Digital Signage Market, By Application
- Germany Digital Signage Market, By Location
- France Digital Signage Market, By Type
- France Digital Signage Market, By Component
- France Digital Signage Market, By Technology
- France Digital Signage Market, By Application
- France Digital Signage Market, By Location
- UK Digital Signage Market, By Type
- UK Digital Signage Market, By Component
- UK Digital Signage Market, By Technology
- UK Digital Signage Market, By Application
- UK Digital Signage Market, By Location
- Italy Digital Signage Market, By Type
- Italy Digital Signage Market, By Component
- Italy Digital Signage Market, By Technology
- Italy Digital Signage Market, By Application
- Italy Digital Signage Market, By Location
- Spain Digital Signage Market, By Type
- Spain Digital Signage Market, By Component
- Rest of Europe Digital Signage Market, By Type
- Rest of Europe Digital Signage Market, By Component
- Rest of Europe Digital Signage Market, By Technology
- Rest of Europe Digital Signage Market, By Application
- Rest of Europe Digital Signage Market, By Location
-
- Asia-Pacific
- Asia-Pacific Digital Signage Market, By Country
- Asia-Pacific Digital Signage Market, By Type
- Asia-Pacific Digital Signage Market, By Component
- Asia-Pacific Digital Signage Market, By Technology
- Asia-Pacific Digital Signage Market, By Application
- Asia-Pacific Digital Signage Market, By Location
- Japan Digital Signage Market, By Type
- Japan Digital Signage Market, By Component
- Japan Digital Signage Market, By Technology
- Japan Digital Signage Market, By Application
- Japan Digital Signage Market, By Location
- Australia Digital Signage Market, By Type
- Australia Digital Signage Market, By Component
- Australia Digital Signage Market, By Technology
- Australia Digital Signage Market, By Application
- Australia Digital Signage Market, By Location
- India Digital Signage Market, By Type
- India Digital Signage Market, By Component
- India Digital Signage Market, By Technology
- India Digital Signage Market, By Application
- India Digital Signage Market, By Location
- South Korea Digital Signage Market, By Type
- South Korea Digital Signage Market, By Component
- South Korea Digital Signage Market, By Technology
- South Korea Digital Signage Market, By Application
- South Korea Digital Signage Market, By Location
- Rest of Asia-Pacific Digital Signage Market, By Type
- Rest of Asia-Pacific Digital Signage Market, By Component
- Rest of Asia-Pacific Digital Signage Market, By Technology
- Rest of Asia-Pacific Digital Signage Market, By Application
- Rest of Asia-Pacific Digital Signage Market, By Location
- Asia-Pacific
-
- Rest of the World
- Rest of the World Digital Signage Market, By Country
- Rest of the World Digital Signage Market, By Type
- Rest of the World Digital Signage Market, By Component
- Rest of the World Digital Signage Market, By Technology
- Rest of the World Digital Signage Market, By Application
- Rest of the World Digital Signage Market, By Location
- Brazil Digital Signage Market, By Type
- Brazil Digital Signage Market, By Component
- Brazil Digital Signage Market, By Technology
- Brazil Digital Signage Market, By Application
- Brazil Digital Signage Market, By Location
- South Africa Digital Signage Market, By Type
- South Africa Digital Signage Market, By Component
- South Africa Digital Signage Market, By Technology
- South Africa Digital Signage Market, By Application
- South Africa Digital Signage Market, By Location
- Saudi Arabia Digital Signage Market, By Type
- Saudi Arabia Digital Signage Market, By Component
- Saudi Arabia Digital Signage Market, By Technology
- Saudi Arabia Digital Signage Market, By Application
- Saudi Arabia Digital Signage Market, By Location
- Turkey Digital Signage Market, By Type
- Turkey Digital Signage Market, By Component
- Turkey Digital Signage Market, By Technology
- Turkey Digital Signage Market, By Application
- Turkey Digital Signage Market, By Location
- United Arab Emirates Digital Signage Market, By Type
- United Arab Emirates Digital Signage Market, By Component
- United Arab Emirates Digital Signage Market, By Technology
- United Arab Emirates Digital Signage Market, By Application
- United Arab Emirates Digital Signage Market, By Location
- Others Digital Signage Market, By Type
- Others Digital Signage Market, By Component
- Others Digital Signage Market, By Technology
- Others Digital Signage Market, By Application
- Others Digital Signage Market, By Location
- Rest of the World
Table of Contents
1. Introduction
1.1. Report Description
1.2. Research Methodology
1.2.1. Secondary Research
1.2.2. Primary Research
2. Executive Summary
2.1. Key Highlights
3. Market Overview
3.1. Introduction
3.1.1. Market Definition
3.1.2. Market Segmentation
3.2. Market Dynamics
3.2.1. Drivers
3.2.1.1. Rising Demand for Interactive and 3D Signage
3.2.1.2. Increasing Need of Reducing the Cost of Reaching Target Customers for Enterprises
3.2.1.3. Increasing Emphasis on Brand-awareness
3.2.2. Restraints
3.2.2.1. Lack of Standardization
3.2.3. Opportunities
3.2.3.1. Technological Innovations in Digital Signage
4. Digital Signage Market, By Type
4.1. Introduction
4.2. The Digital Signage Market Assessment and Forecast, By Type, 2012-2022
4.3. Video Walls
4.3.1. Market Assessment and Forecast, By Region, 2012-2022 ($Million)
4.4. Transparent LED Screens
4.4.1. Market Assessment and Forecast, By Region, 2012-2022 ($Million)
4.5. Video Screens
4.5.1. Market Assessment and Forecast, By Region, 2012-2022 ($Million)
4.6. Kiosks
4.6.1. Market Assessment and Forecast, By Region, 2012-2022 ($Million)
4.7. Digital Posters
4.7.1. Market Assessment and Forecast, By Region, 2012-2022 ($Million)
4.8. Other Signage Types
4.8.1. Market Assessment and Forecast, By Region, 2012-2022 ($Million)
5. Digital Signage Market, By Component
5.1. Introduction
5.2. The Digital Signage Market Assessment and Forecast, By Component 2012-2022
5.3. Software
5.3.1. Market Assessment and Forecast, By Region, 2012-2022 ($Million)
5.4. Hardware
5.4.1. Market Assessment and Forecast, By Region, 2012-2022 ($Million)
5.5. Services
5.5.1. Market Assessment and Forecast, By Region, 2012-2022 ($Million)
6. Digital Signage Market, By Technology
6.1. Introduction
6.2. Digital Signage Market Assessment and Forecast, By Technology, 2012-2022 ($Million)
6.3. Projection
6.3.1. Market Assessment and Forecast, By Region, 2012-2022 ($Million)
6.4. LED
6.4.1. Market Assessment and Forecast, By Region, 2012-2022 ($Million)
6.5. LCD
6.5.1. Market Assessment and Forecast, By Region, 2012-2022 ($Million)
7. Digital Signage Market, By Application
7.1. Introduction
7.2. Digital Signage Market Assessment and Forecast, By Technology, 2012-2022 ($Million)
7.3. Corporate
7.3.1. Market Assessment and Forecast, By Region, 2012-2022 ($Million)
7.4. Retail
7.4.1. Market Assessment and Forecast, By Region, 2012-2022 ($Million)
7.5. Transportation
7.5.1. Market Assessment and Forecast, By Region, 2012-2022 ($Million)
7.6. Banking
7.6.1. Market Assessment and Forecast, By Region, 2012-2022 ($Million)
7.7. Education
7.7.1. Market Assessment and Forecast, By Region, 2012-2022 ($Million)
7.8. Healthcare
7.8.1. Market Assessment and Forecast, By Region, 2012-2022 ($Million)
8. Digital Signage Market, By Location
8.1. Introduction
8.2. Digital Signage Market Assessment and Forecast, By Technology, 2012-2022 ($Million)
8.3. Out-store
8.3.1. Market Assessment and Forecast, By Region, 2012-2022 ($Million)
8.4. In-store
8.4.1. Market Assessment and Forecast, By Region, 2012-2022 ($Million)
9. Digital Signage Market, By Region
9.1. Introduction
9.2. Digital Signage Market Assessment and Forecast, By Region, 2012-2022 ($Million)
9.3. North America
9.3.1. Market Assessment and Forecast, By Country, 2012-2022 ($Million)
9.3.2. Market Assessment and Forecast, By Type, 2012-2022 ($Million)
9.3.3. Market Assessment and Forecast, By Component, 2012-2022 ($Million)
9.3.4. Market Assessment and Forecast, By Technology, 2012-2022 ($Million)
9.3.5. Market Assessment and Forecast, By Application, 2012-2022 ($Million)
9.3.6. Market Assessment and Forecast, By Location, 2012-2022 ($Million)
9.3.7. U.S.
9.3.7.1. Market Assessment and Forecast, By Type, 2012-2022 ($Million)
9.3.7.2. Market Assessment and Forecast, By Component, 2012-2022 ($Million)
9.3.7.3. Market Assessment and Forecast, By Technology, 2012-2022 ($Million)
9.3.7.4. Market Assessment and Forecast, By Application, 2012-2022 ($Million)
9.3.7.5. Market Assessment and Forecast, By Location, 2012-2022 ($Million)
9.3.8. Canada
9.3.8.1. Market Assessment and Forecast, By Type, 2012-2022 ($Million)
9.3.8.2. Market Assessment and Forecast, By Component, 2012-2022 ($Million)
9.3.8.3. Market Assessment and Forecast, By Technology, 2012-2022 ($Million)
9.3.8.4. Market Assessment and Forecast, By Application, 2012-2022 ($Million)
9.3.8.5. Market Assessment and Forecast, By Location, 2012-2022 ($Million)
9.3.9. Mexico
9.3.9.1. Market Assessment and Forecast, By Type, 2012-2022 ($Million)
9.3.9.2. Market Assessment and Forecast, By Component, 2012-2022 ($Million)
9.3.9.3. Market Assessment and Forecast, By Technology, 2012-2022 ($Million)
9.3.9.4. Market Assessment and Forecast, By Application, 2012-2022 ($Million)
9.3.9.5. Market Assessment and Forecast, By Location, 2012-2022 ($Million)
9.4. Europe
9.4.1. Market Assessment and Forecast, By Country, 2012-2022 ($Million)
9.4.2. Market Assessment and Forecast, By Type, 2012-2022 ($Million)
9.4.3. Market Assessment and Forecast, By Component, 2012-2022 ($Million)
9.4.4. Market Assessment and Forecast, By Technology, 2012-2022 ($Million)
9.4.5. Market Assessment and Forecast, By Application, 2012-2022 ($Million)
9.4.6. Market Assessment and Forecast, By Location, 2012-2022 ($Million)
9.4.7. Germany
9.4.7.1. Market Assessment and Forecast, By Type, 2012-2022 ($Million)
9.4.7.2. Market Assessment and Forecast, By Component, 2012-2022 ($Million)
9.4.7.3. Market Assessment and Forecast, By Technology, 2012-2022 ($Million)
9.4.7.4. Market Assessment and Forecast, By Application, 2012-2022 ($Million)
9.4.7.5. Market Assessment and Forecast, By Location, 2012-2022 ($Million)
9.4.8. France
9.4.8.1. Market Assessment and Forecast, By Type, 2012-2022 ($Million)
9.4.8.2. Market Assessment and Forecast, By Component, 2012-2022 ($Million)
9.4.8.3. Market Assessment and Forecast, By Technology, 2012-2022 ($Million)
9.4.8.4. Market Assessment and Forecast, By Application, 2012-2022 ($Million)
9.4.8.5. Market Assessment and Forecast, By Location, 2012-2022 ($Million)
9.4.9. UK
9.4.9.1. Market Assessment and Forecast, By Type, 2012-2022 ($Million)
9.4.9.2. Market Assessment and Forecast, By Component, 2012-2022 ($Million)
9.4.9.3. Market Assessment and Forecast, By Technology, 2012-2022 ($Million)
9.4.9.4. Market Assessment and Forecast, By Application, 2012-2022 ($Million)
9.4.9.5. Market Assessment and Forecast, By Location, 2012-2022 ($Million)
9.4.10. Italy
9.4.10.1. Market Assessment and Forecast, By Type, 2012-2022 ($Million)
9.4.10.2. Market Assessment and Forecast, By Component, 2012-2022 ($Million)
9.4.10.3. Market Assessment and Forecast, By Technology, 2012-2022 ($Million)
9.4.10.4. Market Assessment and Forecast, By Application, 2012-2022 ($Million)
9.4.10.5. Market Assessment and Forecast, By Location, 2012-2022 ($Million)
9.4.11. Spain
9.4.11.1. Market Assessment and Forecast, By Type, 2012-2022 ($Million)
9.4.11.2. Market Assessment and Forecast, By Component, 2012-2022 ($Million)
9.4.11.3. Market Assessment and Forecast, By Technology, 2012-2022 ($Million)
9.4.11.4. Market Assessment and Forecast, By Application, 2012-2022 ($Million)
9.4.11.5. Market Assessment and Forecast, By Location, 2012-2022 ($Million)
9.4.12. Rest of Europe
9.4.12.1. Market Assessment and Forecast, By Type, 2012-2022 ($Million)
9.4.12.2. Market Assessment and Forecast, By Component, 2012-2022 ($Million)
9.4.12.3. Market Assessment and Forecast, By Technology, 2012-2022 ($Million)
9.4.12.4. Market Assessment and Forecast, By Application, 2012-2022 ($Million)
9.4.12.5. Market Assessment and Forecast, By Location, 2012-2022 ($Million)
9.5. Asia-Pacific
9.5.1. Market Assessment and Forecast, By Country, 2012-2022 ($Million)
9.5.2. Market Assessment and Forecast, By Type, 2012-2022 ($Million)
9.5.3. Market Assessment and Forecast, By Component, 2012-2022 ($Million)
9.5.4. Market Assessment and Forecast, By Technology, 2012-2022 ($Million)
9.5.5. Market Assessment and Forecast, By Application, 2012-2022 ($Million)
9.5.6. Market Assessment and Forecast, By Location, 2012-2022 ($Million)
9.5.7. Japan
9.5.7.1. Market Assessment and Forecast, By Type, 2012-2022 ($Million)
9.5.7.2. Market Assessment and Forecast, By Component, 2012-2022 ($Million)
9.5.7.3. Market Assessment and Forecast, By Technology, 2012-2022 ($Million)
9.5.7.4. Market Assessment and Forecast, By Application, 2012-2022 ($Million)
9.5.7.5. Market Assessment and Forecast, By Location, 2012-2022 ($Million)
9.5.8. China
9.5.8.1. Market Assessment and Forecast, By Type, 2012-2022 ($Million)
9.5.8.2. Market Assessment and Forecast, By Component, 2012-2022 ($Million)
9.5.8.3. Market Assessment and Forecast, By Technology, 2012-2022 ($Million)
9.5.8.4. Market Assessment and Forecast, By Application, 2012-2022 ($Million)
9.5.8.5. Market Assessment and Forecast, By Location, 2012-2022 ($Million)
9.5.9. Australia
9.5.9.1. Market Assessment and Forecast, By Type, 2012-2022 ($Million)
9.5.9.2. Market Assessment and Forecast, By Component, 2012-2022 ($Million)
9.5.9.3. Market Assessment and Forecast, By Technology, 2012-2022 ($Million)
9.5.9.4. Market Assessment and Forecast, By Location, 2012-2022 ($Million)
9.5.10. India
9.5.10.1. Market Assessment and Forecast, By Type, 2012-2022 ($Million)
9.5.10.2. Market Assessment and Forecast, By Component, 2012-2022 ($Million)
9.5.10.3. Market Assessment and Forecast, By Technology, 2012-2022 ($Million)
9.5.10.4. Market Assessment and Forecast, By Application, 2012-2022 ($Million)
9.5.10.5. Market Assessment and Forecast, By Location, 2012-2022 ($Million)
9.5.11. South Korea
9.5.11.1. Market Assessment and Forecast, By Type, 2012-2022 ($Million)
9.5.11.2. Market Assessment and Forecast, By Component, 2012-2022 ($Million)
9.5.11.3. Market Assessment and Forecast, By Technology, 2012-2022 ($Million)
9.5.11.4. Market Assessment and Forecast, By Application, 2012-2022 ($Million)
9.5.11.5. Market Assessment and Forecast, By Location, 2012-2022 ($Million)
9.5.12. Rest of Asia-Pacific
9.5.12.1. Market Assessment and Forecast, By Type, 2012-2022 ($Million)
9.5.12.2. Market Assessment and Forecast, By Component, 2012-2022 ($Million)
9.5.12.3. Market Assessment and Forecast, By Technology, 2012-2022 ($Million)
9.5.12.4. Market Assessment and Forecast, By Application, 2012-2022 ($Million)
9.5.12.5. Market Assessment and Forecast, By Location, 2012-2022 ($Million)
9.6. Rest of the World
9.6.1. Market Assessment and Forecast, By Country, 2012-2022 ($Million)
9.6.2. Market Assessment and Forecast, By Type, 2012-2022 ($Million)
9.6.3. Market Assessment and Forecast, By Component, 2012-2022 ($Million)
9.6.4. Market Assessment and Forecast, By Technology, 2012-2022 ($Million)
9.6.5. Market Assessment and Forecast, By Application, 2012-2022 ($Million)
9.6.6. Market Assessment and Forecast, By Location, 2012-2022 ($Million)
9.6.7. Brazil
9.6.7.1. Market Assessment and Forecast, By Type, 2012-2022 ($Million)
9.6.7.2. Market Assessment and Forecast, By Component, 2012-2022 ($Million)
9.6.7.3. Market Assessment and Forecast, By Technology, 2012-2022 ($Million)
9.6.7.4. Market Assessment and Forecast, By Application, 2012-2022 ($Million)
9.6.7.5. Market Assessment and Forecast, By Location, 2012-2022 ($Million)
9.6.8. Turkey
9.6.8.1. Market Assessment and Forecast, By Type, 2012-2022 ($Million)
9.6.8.2. Market Assessment and Forecast, By Component, 2012-2022 ($Million)
9.6.8.3. Market Assessment and Forecast, By Technology, 2012-2022 ($Million)
9.6.8.4. Market Assessment and Forecast, By Application, 2012-2022 ($Million)
9.6.8.5. Market Assessment and Forecast, By Location, 2012-2022 ($Million)
9.6.9. Saudi Arabia
9.6.9.1. Market Assessment and Forecast, By Type, 2012-2022 ($Million)
9.6.9.2. Market Assessment and Forecast, By Component, 2012-2022 ($Million)
9.6.9.3. Market Assessment and Forecast, By Technology, 2012-2022 ($Million)
9.6.9.4. Market Assessment and Forecast, By Application, 2012-2022 ($Million)
9.6.9.5. Market Assessment and Forecast, By Location, 2012-2022 ($Million)
9.6.10. South Africa
9.6.10.1. Market Assessment and Forecast, By Type, 2012-2022 ($Million)
9.6.10.2. Market Assessment and Forecast, By Component, 2012-2022 ($Million)
9.6.10.3. Market Assessment and Forecast, By Technology, 2012-2022 ($Million)
9.6.10.4. Market Assessment and Forecast, By Application, 2012-2022 ($Million)
9.6.10.5. Market Assessment and Forecast, By Location, 2012-2022 ($Million)
9.6.11. United Arab Emirates
9.6.11.1. Market Assessment and Forecast, By Type, 2012-2022 ($Million)
9.6.11.2. Market Assessment and Forecast, By Component, 2012-2022 ($Million)
9.6.11.3. Market Assessment and Forecast, By Technology, 2012-2022 ($Million)
9.6.11.4. Market Assessment and Forecast, By Application, 2012-2022 ($Million)
9.6.11.5. Market Assessment and Forecast, By Location, 2012-2022 ($Million)
9.6.12. Others
9.6.12.1. Market Assessment and Forecast, By Type, 2012-2022 ($Million)
9.6.12.2. Market Assessment and Forecast, By Component, 2012-2022 ($Million)
9.6.12.3. Market Assessment and Forecast, By Technology, 2012-2022 ($Million)
9.6.12.4. Market Assessment and Forecast, By Application, 2012-2022 ($Million)
9.6.12.5. Market Assessment and Forecast, By Location, 2012-2022 ($Million)
10. Company Profiles
10.1. Adflow Networks, Inc. (Daktronics)
10.1.1. Business Overview
10.1.2. Type Portfolio
10.1.3. Key Financials
10.1.4. Strategic Developments
10.2. BrightSign LLC
10.2.1. Business Overview
10.2.2. Type Portfolio
10.2.3. Key Financials
10.2.4. Strategic Developments
10.3. Cisco Systems, Inc.
10.3.1. Business Overview
10.3.2. Type Portfolio
10.3.3. Key Financials
10.3.4. Strategic Developments
10.4. Intel Corporation
10.4.1. Business Overview
10.4.2. Type Portfolio
10.4.3. Strategic Developments
10.5. KeyWest Technology, Inc.
10.5.1. Business Overview
10.5.2. Type Portfolio
10.5.3. Key Financials
10.5.4. Strategic Developments
10.6. Microsoft Corporation
10.6.1. Business Overview
10.6.2. Type Portfolio
10.6.3. Key Financials
10.6.4. Strategic Developments
10.7. LG Electronics (LG Corporation)
10.7.1. Business Overview
10.7.2. Type Portfolio
10.7.3. Key Financials
10.7.4. Strategic Developments
10.8. NEC Display Solutions Ltd.
10.8.1. Business Overview
10.8.2. Type Portfolio
10.8.3. Key Financials
10.8.4. Strategic Developments
10.9. Samsung Electronics
10.9.1. Business Overview
10.9.2. Type Portfolio
10.9.3. Key Financials
10.9.4. Strategic Developments
10.10. Panasonic Corporation
10.10.1. Business Overview
10.10.2. Type Portfolio
10.10.3. Key Financials
10.10.4. Strategic Developments
10.11. Omnivex Corporation
10.11.1. Business Overview
10.11.2. Type Portfolio
10.11.3. Key Financials
10.11.4. Strategic Developments
10.12. Winmate Communication, Inc.
10.12.1. Business Overview
10.12.2. Type Portfolio
10.12.3. Key Financials
10.12.4. Strategic Developments
List of Tables
Table 1.Global Digital Signage Market, By Type, 2012-2022 ($Million)
Table 2.Video Walls Market, By Region, 2012-2022 ($Million)
Table 3.Transparent LED Screens Market, By Region, 2012-2022 ($Million)
Table 4.Video Screens Market, By Region, 2012-2022 ($Million)
Table 5.Kiosks Market, By Region, 2012-2022 ($Million)
Table 6.Digital Posters Market, By Region, 2012-2022 ($Million)
Table 6.Other Signage Types Market, By Region, 2012-2022 ($Million)
Table 7.Digital Signage Market, By Component, 2012-2022 ($Million)
Table 8.Software Market, By Region, 2012-2022 ($Million)
Table 9.Hardware Market, By Type, 2012-2022 ($Million)
Table 10.Services Market, By Region, 2012-2022 ($Million)
Table 11.Digital Signage Market, By Technology, 2012-2022 ($Million)
Table 12.Projection Market, By Region, 2012-2022 ($Million)
Table 13.LED Market, By Region, 2012-2022 ($Million)
Table 14.LCD Market, By Region, 2012-2022 ($Million)
Table 15.Digital Signage Market, By Application, 2012-2022 ($Million)
Table 16.Corporate Market, By Region, 2012-2022 ($Million)
Table 17.Retail Market, By Region, 2012-2022 ($Million)
Table 18.Transportation Market, By Region, 2012-2022 ($Million)
Table 19.Banking Market, By Region, 2012-2022 ($Million)
Table 20.Education Market, By Region, 2012-2022 ($Million)
Table 21.Healthcare Market, By Region, 2012-2022 ($Million)
Table 22.Digital Signage Market, By Location, 2012-2022 ($Million)
Table 23.Out-store Market, By Region, 2012-2022 ($Million)
Table 24.In-store Market, By Region, 2012-2022 ($Million)
Table 25.Digital Signage Market, By Region, 2012-2022 ($Million)
Table 26.North America Digital Signage Market, By Country, 2012-2022 ($Million)
Table 27.North America Digital Signage Market, By Type, 2012-2022 ($Million)
Table 28.North America Digital Signage Market, By Component, 2012-2022 ($Million)
Table 29.North America Digital Signage Market, By Technology, 2012-2022 ($Million)
Table 30.North America Digital Signage Market, By Application, 2012-2022 ($Million)
Table 31.North America Digital Signage Market, By Location, 2012-2022 ($Million)
Table 32.U.S. Digital Signage Market, By Type, 2012-2022 ($Million)
Table 33.U.S. Digital Signage Market, By Component, 2012-2022 ($Million)
Table 34.U.S. Digital Signage Market, By Technology, 2012-2022 ($Million)
Table 35.U.S. Digital Signage Market, By Application, 2012-2022 ($Million)
Table 36.U.S. Digital Signage Market, By Location, 2012-2022 ($Million)
Table 37.Canada Digital Signage Market, By Type, 2012-2022 ($Million)
Table 38.Canada Digital Signage Market, By Component, 2012-2022 ($Million)
Table 39.Canada Digital Signage Market, By Technology, 2012-2022 ($Million)
Table 40.Canada Digital Signage Market, By Application, 2012-2022 ($Million)
Table 41.Canada Digital Signage Market, By Location, 2012-2022 ($Million)
Table 42.Mexico Digital Signage Market, By Type, 2012-2022 ($Million)
Table 43.Mexico Digital Signage Market, By Component, 2012-2022 ($Million)
Table 44.Mexico Digital Signage Market, By Technology, 2012-2022 ($Million)
Table 45.Mexico Digital Signage Market, By Application, 2012-2022 ($Million)
Table 46.Mexico Digital Signage Market, By Location, 2012-2022 ($Million)
Table 47.Europe Digital Signage Market, By Country, 2012-2022 ($Million)
Table 48.Europe Digital Signage Market, By Type, 2012-2022 ($Million)
Table 49.Europe Digital Signage Market, By Component, 2012-2022 ($Million)
Table 50.Europe Digital Signage Market, By Technology, 2012-2022 ($Million)
Table 51.Europe Digital Signage Market, By Application, 2012-2022 ($Million)
Table 52.Europe Digital Signage Market, By Location, 2012-2022 ($Million)
Table 53.Germany Digital Signage Market, By Type, 2012-2022 ($Million)
Table 54.Germany Digital Signage Market, By Component, 2012-2022 ($Million)
Table 55.Germany Digital Signage Market, By Technology, 2012-2022 ($Million)
Table 56.Germany Digital Signage Market, By Application, 2012-2022 ($Million)
Table 57.Germany Digital Signage Market, By Location, 2012-2022 ($Million)
Table 58.France Digital Signage Market, By Type, 2012-2022 ($Million)
Table 59.France Digital Signage Market, By Component, 2012-2022 ($Million)
Table 60.France Digital Signage Market, By Technology, 2012-2022 ($Million)
Table 61.France Digital Signage Market, By Application, 2012-2022 ($Million)
Table 62.France Digital Signage Market, By Location, 2012-2022 ($Million)
Table 63.UK Digital Signage Market, By Type, 2012-2022 ($Million)
Table 64.UK Digital Signage Market, By Component, 2012-2022 ($Million)
Table 65.UK Digital Signage Market, By Technology, 2012-2022 ($Million)
Table 66.UK Digital Signage Market, By Application, 2012-2022 ($Million)
Table 67.UK Digital Signage Market, By Location, 2012-2022 ($Million)
Table 68.Italy Digital Signage Market, By Type, 2012-2022 ($Million)
Table 69.Italy Digital Signage Market, By Component, 2012-2022 ($Million)
Table 70.Italy Digital Signage Market, By Technology, 2012-2022 ($Million)
Table 71.Italy Digital Signage Market, By Application, 2012-2022 ($Million)
Table 72.Italy Digital Signage Market, By Location, 2012-2022 ($Million)
Table 73.Spain Digital Signage Market, By Type, 2012-2022 ($Million)
Table 74.Spain Digital Signage Market, By Component, 2012-2022 ($Million)
Table 75.Spain Digital Signage Market, By Technology, 2012-2022 ($Million)
Table 76.Spain Digital Signage Market, By Application, 2012-2022 ($Million)
Table 77.Spain Digital Signage Market, By Location, 2012-2022 ($Million)
Table 78.Rest of Europe Digital Signage Market, By Type, 2012-2022 ($Million)
Table 79.Rest of Europe Digital Signage Market, By Component, 2012-2022 ($Million)
Table 80.Rest of Europe Digital Signage Market, By Technology, 2012-2022 ($Million)
Table 81.Rest of Europe Digital Signage Market, By Application, 2012-2022 ($Million)
Table 82.Rest of Europe Digital Signage Market, By Location, 2012-2022 ($Million)
Table 83.Asia-Pacific Digital Signage Market, By Country, 2012-2022 ($Million)
Table 84.Asia-Pacific Digital Signage Market, By Type, 2012-2022 ($Million)
Table 85.Asia-Pacific Digital Signage Market, By Component, 2012-2022 ($Million)
Table 86.Asia-Pacific Digital Signage Market, By Technology, 2012-2022 ($Million)
Table 87.Asia-Pacific Digital Signage Market, By Application, 2012-2022 ($Million)
Table 88.Asia-Pacific Digital Signage Market, By Location, 2012-2022 ($Million)
Table 89.Japan Digital Signage Market, By Type, 2012-2022 ($Million)
Table 90.Japan Digital Signage Market, By Component, 2012-2022 ($Million)
Table 91.Japan Digital Signage Market, By Technology, 2012-2022 ($Million)
Table 92.Japan Digital Signage Market, By Application, 2012-2022 ($Million)
Table 93.Japan Digital Signage Market, By Location, 2012-2022 ($Million)
Table 94.China Digital Signage Market, By Type, 2012-2022 ($Million)
Table 95.China Digital Signage Market, By Component, 2012-2022 ($Million)
Table 96.China Digital Signage Market, By Technology, 2012-2022 ($Million)
Table 97.China Digital Signage Market, By Application, 2012-2022 ($Million)
Table 98.China Digital Signage Market, By Location, 2012-2022 ($Million)
Table 99.Australia Digital Signage Market, By Type, 2012-2022 ($Million)
Table 100.Australia Digital Signage Market, By Component, 2012-2022 ($Million)
Table 101.Australia Digital Signage Market, By Technology, 2012-2022 ($Million)
Table 102.Australia Digital Signage Market, By Application, 2012-2022 ($Million)
Table 103.Australia Digital Signage Market, By Location, 2012-2022 ($Million)
Table 104.India Digital Signage Market, By Type, 2012-2022 ($Million)
Table 105.India Digital Signage Market, By Component, 2012-2022 ($Million)
Table 106.India Digital Signage Market, By Technology, 2012-2022 ($Million)
Table 107.India Digital Signage Market, By Application, 2012-2022 ($Million)
Table 108.India Digital Signage Market, By Location, 2012-2022 ($Million)
Table 109.South Korea Digital Signage Market, By Type, 2012-2022 ($Million)
Table 110.South Korea Digital Signage Market, By Component, 2012-2022 ($Million)
Table 111.South Korea Digital Signage Market, By Technology, 2012-2022 ($Million)
Table 112.South Korea Digital Signage Market, By Application, 2012-2022 ($Million)
Table 113.South Korea Digital Signage Market, By Location, 2012-2022 ($Million)
Table 114.Rest of Asia-Pacific Digital Signage Market, By Type, 2012-2022 ($Million)
Table 115.Rest of Asia-Pacific Digital Signage Market, By Component, 2012-2022 ($Million)
Table 116.Rest of Asia-Pacific Digital Signage Market, By Technology, 2012-2022 ($Million)
Table 117.Rest of Asia-Pacific Digital Signage Market, By Application, 2012-2022 ($Million)
Table 118.Rest of Asia-Pacific Digital Signage Market, By Location, 2012-2022 ($Million)
Table 119.Rest of the World Digital Signage Market, By Country, 2012-2022 ($Million)
Table 120.Rest of the World Digital Signage Market, By Type, 2012-2022 ($Million)
Table 121.Rest of the World Digital Signage Market, By Component, 2012-2022 ($Million)
Table 122.Rest of the World Digital Signage Market, By Technology, 2012-2022 ($Million)
Table 123.Rest of the World Digital Signage Market, By Application, 2012-2022 ($Million)
Table 124.Rest of the World Digital Signage Market, By Location, 2012-2022 ($Million)
Table 125.Brazil Digital Signage Market, By Type, 2012-2022 ($Million)
Table 126.Brazil Digital Signage Market, By Component, 2012-2022 ($Million)
Table 127.Brazil Digital Signage Market, By Technology, 2012-2022 ($Million)
Table 128.Brazil Digital Signage Market, By Application, 2012-2022 ($Million)
Table 129.Brazil Digital Signage Market, By Location, 2012-2022 ($Million)
Table 130.Turkey Digital Signage Market, By Type, 2012-2022 ($Million)
Table 131.Turkey Digital Signage Market, By Component, 2012-2022 ($Million)
Table 132.Turkey Digital Signage Market, By Technology, 2012-2022 ($Million)
Table 133.Turkey Digital Signage Market, By Application, 2012-2022 ($Million)
Table 134.Turkey Digital Signage Market, By Location, 2012-2022 ($Million)
Table 135.Saudi Arabia Digital Signage Market, By Type, 2012-2022 ($Million)
Table 136.Saudi Arabia Digital Signage Market, By Component, 2012-2022 ($Million)
Table 137.Saudi Arabia Digital Signage Market, By Technology, 2012-2022 ($Million)
Table 138.Saudi Arabia Digital Signage Market, By Application, 2012-2022 ($Million)
Table 139.Saudi Arabia Digital Signage Market, By Location, 2012-2022 ($Million)
Table 140.South Africa Digital Signage Market, By Type, 2012-2022 ($Million)
Table 141.South Africa Digital Signage Market, By Component, 2012-2022 ($Million)
Table 142.South Africa Digital Signage Market, By Technology, 2012-2022 ($Million)
Table 143.South Africa Digital Signage Market, By Application, 2012-2022 ($Million)
Table 144.South Africa Digital Signage Market, By Location, 2012-2022 ($Million)
Table 145.United Arab Emirates Digital Signage Market, By Type, 2012-2022 ($Million)
Table 146.United Arab Emirates Digital Signage Market, By Component, 2012-2022 ($Million)
Table 147.United Arab Emirates Digital Signage Market, By Technology, 2012-2022 ($Million)
Table 148.United Arab Emirates Digital Signage Market, By Application, 2012-2022 ($Million)
Table 149.United Arab Emirates Digital Signage Market, By Location, 2012-2022 ($Million)
Table 150.Others Digital Signage Market, By Type, 2012-2022 ($Million)
Table 151.Others Digital Signage Market, By Component, 2012-2022 ($Million)
Table 152.Others Digital Signage Market, By Technology, 2012-2022 ($Million)
Table 153.Others Digital Signage Market, By Application, 2012-2022 ($Million)
Table 154.Others Digital Signage Market, By Location, 2012-2022 ($Million)
Table 155.Adflow Networks, Inc. (Daktronics): Key Strategic Developments, 2017-2017
Table 156.BrightSign LLC: Key Strategic Developments, 2017-2017
Table 157.Cisco Systems, Inc.: Key Strategic Developments, 2017-2017
Table 158.Intel Corporation: Key Strategic Developments, 2017-2017
Table 159.KeyWest Technology, Inc.: Key Strategic Developments, 2017-2017
Table 160.Microsoft Corporation: Key Strategic Developments, 2017-2017
Table 161.LG Electronics (LG Corporation): Key Strategic Developments, 2017-2017
Table 162.NEC Display Solutions Ltd.: Key Strategic Developments, 2017-2017
Table 163.Samsung Electronics: Key Strategic Developments, 2017-2017
Table 164.Panasonic Corporation: Key Strategic Developments, 2017-2017
Table 165.Omnivex Corporation: Key Strategic Developments, 2017-2017
Table 167.Winmate Communication, Inc.: Key Strategic Developments, 2017-2017
List of Figures
Figure 1.Digital Signage Market Share, By Type, 2012 & 2022 ($Million)
Figure 2.Digital Signage Market Share, By Component, 2012 & 2022 ($Million)
Figure 3.Digital Signage Market Share, By Technology, 2012 & 2022 ($Million)
Figure 4.Digital Signage Market Share, By Application, 2012 & 2022 ($Million)
Figure 5.Digital Signage Market, By Region, 2012 & 2022, ($Million)
Figure 6.Adflow Networks, Inc. (Daktronics): Net Revenues, 2017-2017 ($Million)
Figure 7.Adflow Networks, Inc. (Daktronics): Net Revenue Share, By Segment, 2017
Figure 8.Adflow Networks, Inc. (Daktronics): Net Revenue Share, By Geography, 2017
Figure 9.BrightSign LLC: Net Revenues, 2017-2017 ($Million)
Figure 10.BrightSign LLC: Net Revenue Share, By Segment, 2017
Figure 11.BrightSign LLC: Net Revenue Share, By Geography, 2017
Figure 12.Cisco Systems, Inc.: Net Revenues, 2017-2017 ($Million)
Figure 13.Cisco Systems, Inc.: Net Revenue Share, By Segment, 2017
Figure 14.Cisco Systems, Inc.: Net Revenue Share, By Geography, 2017
Figure 15.Intel Corporation: Net Revenues, 2017-2017 ($Million)
Figure 16.Intel Corporation: Net Revenue Share, By Segment, 2017
Figure 17.Intel Corporation: Net Revenue Share, By Geography, 2017
Figure 18.KeyWest Technology, Inc.: Net Revenues, 2017-2017 ($Million)
Figure 19.KeyWest Technology, Inc.: Net Revenue Share, By Segment, 2017
Figure 20.KeyWest Technology, Inc.: Net Revenue Share, By Geography, 2017
Figure 21.Microsoft Corporation: Net Revenues, 2017-2017 ($Million)
Figure 22.Microsoft Corporation: Net Revenue Share, By Segment, 2017
Figure 23.Microsoft Corporation: Net Revenue Share, By Geography, 2017
Figure 24.LG Electronics (LG Corporation): Net Revenues, 2017-2017 ($Million)
Figure 25.LG Electronics (LG Corporation): Net Revenue Share, By Segment, 2017
Figure 26.LG Electronics (LG Corporation): Net Revenue Share, By Geography, 2017
Figure 27.NEC Display Solutions Ltd.: Net Revenues, 2017-2017 ($Million)
Figure 28.NEC Display Solutions Ltd.: Net Revenue Share, By Segment, 2017
Figure 29.NEC Display Solutions Ltd.: Net Revenue Share, By Geography, 2017
Figure 30.Samsung Electronics: Net Revenues, 2017-2017 ($Million)
Figure 31.Samsung Electronics: Net Revenue Share, By Segment, 2017
Figure 32.Samsung Electronics: Net Revenue Share, By Geography, 2017
Figure 33.Panasonic Corporation: Net Revenues, 2017-2017 ($Million)
Figure 34.Panasonic Corporation: Net Revenue Share, By Segment, 2017
Figure 35.Panasonic Corporation: Net Revenue Share, By Geography, 2017
Research Methodology
We use both primary as well as secondary research for our market surveys, estimates and for developing forecast. Our research process commence by analyzing the problem which enable us to design the scope for our research study. Our research process is uniquely designed with enough flexibility to adjust according to changing nature of products and markets, while retaining core element to ensure reliability and accuracy in research findings. We understand both macro and micro-economic factors to evaluate and forecast different market segments.
Data Mining
Data is extensively collected through various secondary sources such as annual reports, investor presentations, SEC filings, and other corporate publications. We also refer trade magazines, technical journals, paid databases such as Factiva and Bloomberg, industry trade journals, scientific journals, and social media data to understand market dynamics and industry trends. Further, we also conduct primary research to understand market drivers, restraints, opportunities, challenges, and competitive scenario to build our analysis.
Data Collection Matrix
|
Data Collection Matrix |
Supply Side |
Demand Side |
|
Primary Data Sources |
|
|
|
Secondary Data Sources |
|
|
Market Modeling and Forecasting
We use epidemiology and capital equipment-based models to forecast market size of different segments at country and regional level.
- Epidemiology-based Forecasting Model: This method uses epidemiology data gathered through various publications and from physicians to estimate population of patients, flow of treatment of individual disease and therapies. The data collected through this method includes statics on incidence of disease, population suffering from disease, and treatment population. This method is used to understand:
- Number of patients for particular device or medical procedure and
- Repeated use of particular device depending on health and condition of patient
- Capital-based Forecasting Model: This method of forecasting is based on number of replacements, installed-based and new sales of capital equipment used in various healthcare and diagnostic centers. These three parameters are calculated and forecast is developed. Installation base is calculated as average number of units per facility; while sales for particular year is calculated from number of new and replace units. Secondary data is collected through various supply chain intermediaries and opinion leaders to arrive at installation and sales rate. These techniques help our analysts in validating market and developed market estimates and forecast.
We do forecast on basis of several parameters such as market drivers, market opportunities, industry trends government regulations, raw materials supply and trade dynamics to ensure relevance of forecast with market scenario. With increasing need to granulized information, we used bottom-up methodology for forecasting where we evaluate each regional segment differently and combined all forecast to develop final market forecast.
Data Validation
We believe primary research is a very important tool in analyzing and forecasting different markets. In order to make sure accuracy of our findings, our team conducts primary interviews at every stage of research to gain deep insights into current business environment and future trends and key developments in market. This includes use of various methods such as telephonic interviews, focus groups, face to face interviews and questionnaires to validate our research from all aspects. We validate our data through primary research from key industry leaders such as CEO, product managers, marketing managers, suppliers, distributors, and consumers are frequently interviewed. These interviews provide valuable insights which help us to have better market understanding besides validating our estimates and forecast.
Data Triangulation

Industry Analysis
|
Qualitative Data |
Quantitative Data (2017-2025) |
|
|